


Efficient Market
“Sentimental Analysis” — Why is it the only way to achieve sustainable and substantial profits from the stock market?
I want to introduce you to the concept of the Efficient Market; understanding it will create a revolution in your future trading.
Through sentimental analysis, without using any tools or methods of technical analysis, and even without fundamental analysis, you can predict future price movements in any market and any timeframe with about 70% probability, in just 3 to 10 seconds—simply by identifying the behavior of the key market participants: market makers, institutions, banks, legal entities, and individual traders.
The main focus of this type of analysis is to identify the behavior of influential traders whose actions lead to price movements.
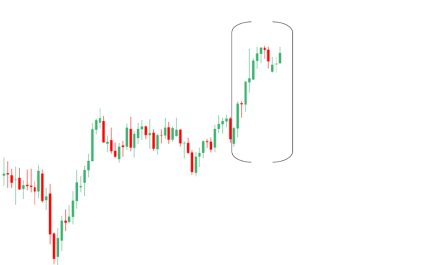
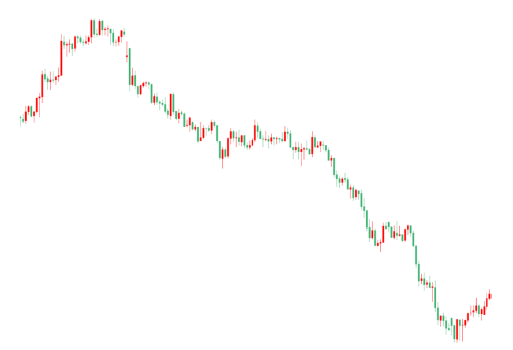
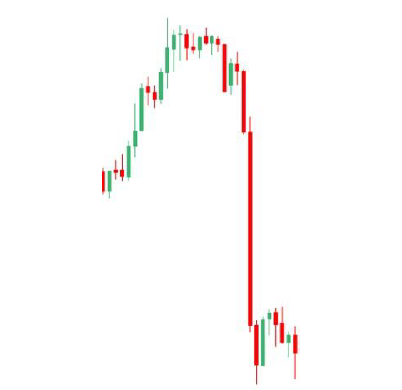
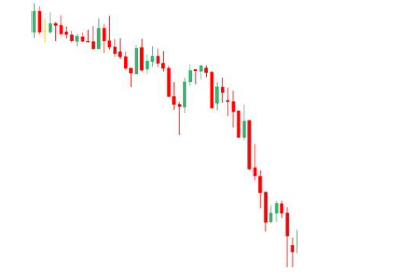
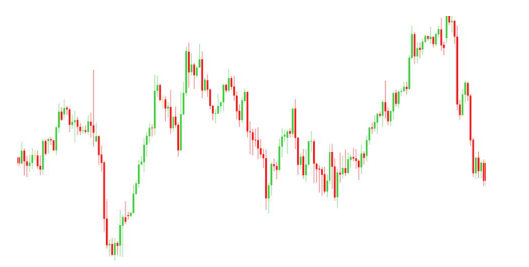
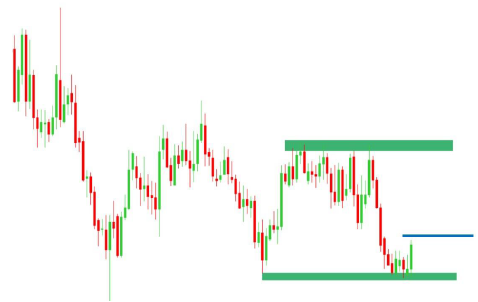
Let’s start simply and quickly. Look at the following example to understand how you can make a trade in this market in less than 10 seconds:
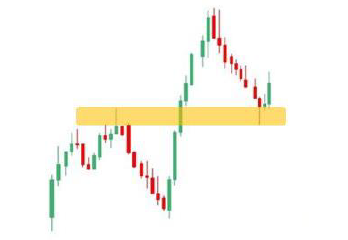
Imagine you are looking at this chart for the first time and decide to trade if conditions are favorable.
We said that in sentimental analysis we don’t use any tools. As you see in this chart, apart from candles and a specific color combination, there is nothing else. We also said that the main focus of the trader here is on understanding the behavior of effective market participants.
Look at the recent price action (inside the highlighted area on the chart).
As you know, there are two types of traders in the market: buyers and sellers. Whenever buyers are stronger than sellers, price rises; whenever sellers are stronger than buyers, price falls.
In the last move, you can easily see that after a strong bullish movement, price made only a weak correction.
Because this powerful move was upward, we can conclude that buyers caused the rally. And when the market corrected, sellers couldn’t push it down strongly enough to weaken the buyers.
So here, we conclude that buyers currently hold the power—and we can enter a Long (buy) position.
That simple!
In this book you will learn:
- How to trace the flow of money in the market to identify trends.
- How to find the exact entry point for a trade.
- How to manage a trade once you are inside.
- How to know when to exit (e.g., when buyers are losing strength or sellers are gaining).
- How to determine how long price will continue its trend so you can follow it.
- And dozens of other key insights.
If you’re reading this book right now, it is not a coincidence. Most likely, you’ve been searching for the Holy Grail of the financial markets—a way to maximize your capital and build unlimited and sustainable income.
By studying this book, you’ll learn a method that took 17 years to develop, structured and organized for you. So don’t measure its value by the price you paid for it; measure it by the transformation it can bring to your life and income.
The Reality of Price
Which technical or fundamental analysis, or which indicator or oscillator, can show you with this much clarity and valid reasoning—based on modern economics—what the next price movement will be?
Think again: do you really need to learn all kinds of technical and fundamental methods, or rely on various indicators mostly used for content creation and entertainment?
The truth is simple: Price itself is reality, because every movement comes only from trades executed by other traders—whether due to technical expectations, fundamental reasons, personal tendencies, emotions, or political, social, and economic events. From the largest institutional trader to the smallest retail trader, price is nothing but the reflection of money flow in the market.
Therefore, to understand the true market reality, you don’t need extra tools—only to see the price itself.
You don’t need to analyze economic or political news to profit in this market, because price movements reveal the hidden truth clearly. In modern economics, price is the mirror of all hidden realities.
Using indicators, oscillators, or endless layers of fundamental/technical analysis only distances you from the core truth (price), often leading to losses or small gains. That’s because your decisions are no longer based on recognizing the actual current conditions, but on misleading tools that have no real understanding of the forces driving price.
Comparing Sentimental vs. Fundamental & Technical Analysis
- Fundamental analysis focuses on studying economic and political news, statistics, and data. A trader must interpret all kinds of information and trade based on possible impacts.
- This method has many weaknesses—the biggest being its inability to provide precise entry and exit points. For years now, in advanced economies, traders no longer rely on this approach for trading, using it only for content, news, or broad economic studies.
- Predictions from fundamental analysis rarely succeed, because ultimately, it’s the traders themselves—driven by emotions, tendencies, expectations, and self-interest—who decide how to act. That’s why many times prices move in the opposite direction of fundamental expectations.
Fundamental analysis used to be more popular in the past. But due to changes in market-making practices, improved price discovery mechanisms, increased liquidity, and deeper markets, its effectiveness in modern trading has diminished.
Types of Traders in the Market
From here on, you will enter the practical training of sentimental analysis. All information from this point forward is crucial, so don’t skip anything.
In the near future, you will become a stock market trader. So let’s see: who are the types of traders in this market, what roles do they play, and how do their actions affect the market?
There are three groups:
- Institutional traders – Responsible for market-making and price discovery as part of broader financial strategies. Their goal is to adjust currency exchange rates or stock prices to benefit their nation’s financial and economic goals.
- Professional traders – Individuals or financial institutions with very large capital. Their trades have big volume but never as much impact as institutional traders.
- Retail traders – That’s us. Traders who trade for themselves, regardless of their account size. By themselves, they have no real effect on the market, except in rare cases when professionals and institutions are absent.
You will learn to quickly, simply, and clearly identify whether price movements come from institutional, professional, or retail traders.
And as you’ve already guessed, our goal is to follow institutional and professional traders, because this market is not created for us retail traders—but fortunately, the system allows us to participate if we align ourselves with the big players.
The Goal of Sentimental Analysis
The goal is to identify future price fluctuations based on meaningful behaviors currently happening in the market.
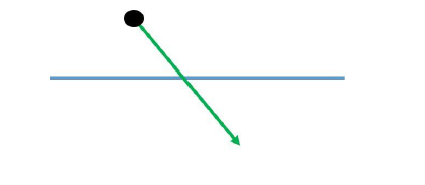
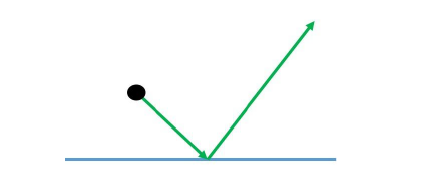
An essential principle here is that what you see is not always reality. What you perceive as correct can be completely wrong.
As Nobel Prize-winning economist Richard Thaler (2017) said: “See the real world around you as it truly is.”
For example, look at an optical illusion: two tables may appear different in size, but when measured, they are exactly the same. This teaches us that perception can deceive us.

Likewise, in the market, what seems true based on common beliefs (technical tools, patterns, indicators) may be misleading.
Ask yourself honestly: among the vast majority of traders who rely on technical and fundamental analysis, how many have truly achieved the financial freedom and satisfaction they were striving for?

Many retail traders keep searching for the “secret indicators” or models used by institutions and professionals—hoping to see the market through their eyes and profit like them. But the reality is, big players don’t care about such tools at all. They use only their knowledge, expertise, and strategies to fulfill their financial objectives and capitalize on opportunitie
Behavioral Economics not only reveals the footprint of institutional and professional traders’ transactions, but also highlights the collective footprint of retail traders’ transactions.
The Concept of an Efficient Market
So far, you’ve learned that in sentimental analysis you don’t need technical analysis, fundamental analysis, or any of the classical financial methods such as Elliott, Gann, Ichimoku, harmonic patterns, candlesticks, etc. Why?
Because sentimental analysis is the art of examining the clues left behind by influential traders in the market. By “footprint,” we mean the transactions and flows of money from institutional, professional, and retail traders.
But an important question arises: how can you track the behavior and money flows of traders in the market using sentimental analysis?
To answer this, you need to be familiar with the concept of the efficient market.
Put simply, an efficient market has the following characteristics. Fortunately, in today’s world, all types of stock exchanges (domestic and international), including stocks, securities, energy, futures, options, currencies, and precious metals, are efficient markets:
- Public accessibility
- Minimal transaction costs compared to expected profits
- Large and liquid
- Clear impact of events, statistics, and information on price
Of course, efficient markets have other characteristics as well, which we won’t cover here—you can learn more from our articles and videos.
We can say that due to the high profitability of the stock markets (both domestic and international), their growing popularity has attracted massive capital inflows, leading to a significant increase in liquidity and market depth, thus transforming stock markets into efficient markets.
That means no single trader can control the market alone or have a major impact on it.
All of this means that in an efficient market, price itself reflects everything happening behind the scenes that drives its changes. So, when we analyze price to identify clues, we are in fact observing all the factors affecting price—without having to deal with unnecessary complexity. This valuable point makes it possible to identify profitable opportunities in any market using sentimental analysis within just 3 to 10 seconds and with a high probability of success.
In other words, if you recognize the correct clues about money flows and traders’ behaviors in the market, it’s as though you’re analyzing the outcomes of economic, political, and social news, statistics, and events—without complexity, cost, or wasted time. You’re conducting all the necessary evaluations for identifying highly probable profitable opportunities.
So the key question is: since you’re trading in an efficient market, which reveals the footprints of money flows and behaviors of influential traders, how can you detect them?
The answer is simple: by using sentimental analysis.
Sentimental analysis is a method that allows you to quickly and easily identify the footprints of money flows and behaviors of influential traders in the market, with no complexity.
The Concept of Basic Market Principles
What is the first step to becoming a professional trader?
By reading this book, you’ve made an important decision for your future: to achieve wealth and unlimited income through stock market trading. That’s a huge, exciting, and fantastic decision!
So let’s look at the first step toward this goal. If you want to become a true professional trader, your first step is to understand the market. Before anything else, you need to know the characteristics of the place from which you’ll earn money.
In other words, the first step toward becoming a professional trader is being able to recognize the realities of the stock market—understanding clearly what is illusion and what is reality.
It may surprise you to know that around 90% of people who lose money in the market share one thing in common: a lack of proper knowledge about the nature of the market they’re trading in. And this could have easily been avoided.
To truly understand the realities of the market, you need to answer two fundamental questions:
- What is price?
- How does price move (change)?
The answers to these two questions are simple but extremely important. Understanding them will help you cut through the illusions and misleading ideas promoted by opportunists through flashy advertising.
What is Price?
Price is the outcome of an agreement between a buyer and a seller that results in two trades: one purchase and one sale.
If a seller wants to sell at a certain price but no buyer agrees, or a buyer wants to buy at a certain price but no seller agrees, that number is not the price. The real price is the one that results in an actual trade.
For example:
Suppose I own a property and want to sell it for 10 billion. A buyer offers 5 billion. Neither of us accepts the other’s offer, so no trade occurs—those numbers are not the price. But if we negotiate and agree to trade at 7 billion, then that number is the price, because it led to both a sale and a purchase.
How Does Price Move?
To answer this, let’s look at an auction.
Imagine an art auction where the auctioneer sets a base price of 50 million for a painting. The audience, believing the painting’s true value is much higher, begins bidding higher.
- The first bidder offers 55 million.
- The second bidder raises to 62 million (7 million higher).
- The third bids 73 million.
- The fourth goes to 90 million.
- The fifth jumps to 115 million.
- The sixth bids 150 million.
Why do they keep bidding higher? Because they still believe the true value exceeds the price, meaning they expect profit from owning it.
However, eventually, bidders begin to think: “This painting is valuable, but the current price is too high—owning it at this level won’t bring much profit.”
At that point, the increments between bids shrink (e.g., from 20 million, to 6 million, etc.), until eventually no one is willing to bid higher.
This is exactly how price moves in financial markets: driven by traders’ enthusiasm, persistence, emotions, decisions, and actions—all shaped by their perception of value relative to price.
When you look at price charts (any market, any timeframe), you can interpret them as if you’re watching an auction. You can see how traders are thinking, how excited they are, and why they act as they do.
This simple yet powerful rule is the foundation of sentimental analysis.Behavioral Economics not only reveals the footprint of institutional and professional traders’ transactions, but also highlights the collective footprint of retail traders’ transactions.
The Concept of an Efficient Market
So far, you’ve learned that in sentimental analysis you don’t need technical analysis, fundamental analysis, or any of the classical financial methods such as Elliott, Gann, Ichimoku, harmonic patterns, candlesticks, etc. Why?
Because sentimental analysis is the art of examining the clues left behind by influential traders in the market. By “footprint,” we mean the transactions and flows of money from institutional, professional, and retail traders.
But an important question arises: how can you track the behavior and money flows of traders in the market using sentimental analysis?
To answer this, you need to be familiar with the concept of the efficient market.
Put simply, an efficient market has the following characteristics. Fortunately, in today’s world, all types of stock exchanges (domestic and international), including stocks, securities, energy, futures, options, currencies, and precious metals, are efficient markets:
- Public accessibility
- Minimal transaction costs compared to expected profits
- Large and liquid
- Clear impact of events, statistics, and information on price
Of course, efficient markets have other characteristics as well, which we won’t cover here—you can learn more from our articles and videos.
We can say that due to the high profitability of the stock markets (both domestic and international), their growing popularity has attracted massive capital inflows, leading to a significant increase in liquidity and market depth, thus transforming stock markets into efficient markets.
That means no single trader can control the market alone or have a major impact on it.
All of this means that in an efficient market, price itself reflects everything happening behind the scenes that drives its changes. So, when we analyze price to identify clues, we are in fact observing all the factors affecting price—without having to deal with unnecessary complexity. This valuable point makes it possible to identify profitable opportunities in any market using sentimental analysis within just 3 to 10 seconds and with a high probability of success.
In other words, if you recognize the correct clues about money flows and traders’ behaviors in the market, it’s as though you’re analyzing the outcomes of economic, political, and social news, statistics, and events—without complexity, cost, or wasted time. You’re conducting all the necessary evaluations for identifying highly probable profitable opportunities.
So the key question is: since you’re trading in an efficient market, which reveals the footprints of money flows and behaviors of influential traders, how can you detect them?
The answer is simple: by using sentimental analysis.
Sentimental analysis is a method that allows you to quickly and easily identify the footprints of money flows and behaviors of influential traders in the market, with no complexity.
The Concept of Basic Market Principles
What is the first step to becoming a professional trader?
By reading this book, you’ve made an important decision for your future: to achieve wealth and unlimited income through stock market trading. That’s a huge, exciting, and fantastic decision!
So let’s look at the first step toward this goal. If you want to become a true professional trader, your first step is to understand the market. Before anything else, you need to know the characteristics of the place from which you’ll earn money.
In other words, the first step toward becoming a professional trader is being able to recognize the realities of the stock market—understanding clearly what is illusion and what is reality.
It may surprise you to know that around 90% of people who lose money in the market share one thing in common: a lack of proper knowledge about the nature of the market they’re trading in. And this could have easily been avoided.
To truly understand the realities of the market, you need to answer two fundamental questions:
- What is price?
- How does price move (change)?
The answers to these two questions are simple but extremely important. Understanding them will help you cut through the illusions and misleading ideas promoted by opportunists through flashy advertising.
What is Price?
Price is the outcome of an agreement between a buyer and a seller that results in two trades: one purchase and one sale.
If a seller wants to sell at a certain price but no buyer agrees, or a buyer wants to buy at a certain price but no seller agrees, that number is not the price. The real price is the one that results in an actual trade.
For example:
Suppose I own a property and want to sell it for 10 billion. A buyer offers 5 billion. Neither of us accepts the other’s offer, so no trade occurs—those numbers are not the price. But if we negotiate and agree to trade at 7 billion, then that number is the price, because it led to both a sale and a purchase.
How Does Price Move?
To answer this, let’s look at an auction.

Imagine an art auction where the auctioneer sets a base price of 50 million for a painting. The audience, believing the painting’s true value is much higher, begins bidding higher.
- The first bidder offers 55 million.
- The second bidder raises to 62 million (7 million higher).
- The third bids 73 million.
- The fourth goes to 90 million.
- The fifth jumps to 115 million.
- The sixth bids 150 million.
Why do they keep bidding higher? Because they still believe the true value exceeds the price, meaning they expect profit from owning it.
However, eventually, bidders begin to think: “This painting is valuable, but the current price is too high—owning it at this level won’t bring much profit.”
At that point, the increments between bids shrink (e.g., from 20 million, to 6 million, etc.), until eventually no one is willing to bid higher.
This is exactly how price moves in financial markets: driven by traders’ enthusiasm, persistence, emotions, decisions, and actions—all shaped by their perception of value relative to price.
When you look at price charts (any market, any timeframe), you can interpret them as if you’re watching an auction. You can see how traders are thinking, how excited they are, and why they act as they do.
This simple yet powerful rule is the foundation of sentimental analysis.
So, you’ve learned that price moves only based on the auction theory. Suppose you buy a car for 500 million, then someone else buys the same car from you for 550 million. Here, we say that the price of this car has not remained fixed but has moved.
The same thing happens in markets: when buying and selling take place at different prices, the price moves.
Now, a question: when does the price move upward, and when does it move downward?
As long as there are people in the market willing to buy at higher prices, the price will move upward. And as long as there are people in the market willing to sell at lower prices, the price will move downward.
So, now you understand what’s behind the scenes when an upward or downward trend forms in the market.
Up to this point, you’ve learned what price is and how it moves. But now, let’s talk about traders.
Next, we’ll examine the actions traders take in the market, how they are categorized, and how each of these actions affects price movements.
This topic will greatly help you in identifying profitable trading opportunities and many other things.
Types of Trader Actions and Their Impact on Price
You’ve already understood that in all financial markets, price moves as a result of the trades executed by traders present in the market.
In general, there are only two types of trading actions in the market:
- Buying
- Selling
But each of these (buy and sell) happens in two different ways in the market, each with its own unique effects, which we will now discuss.
As you know, there are two types of financial markets: one-sided and two-sided. In one-sided markets, you can only profit when prices rise. But in two-sided markets, you can also profit when prices fall.
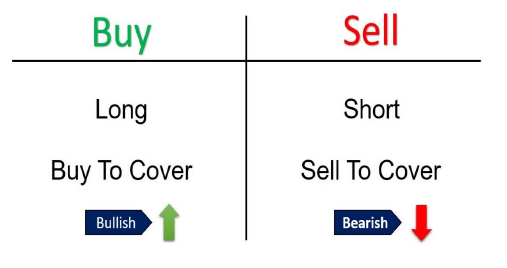
When traders enter the market with the goal of profiting from rising prices, it’s called going Long. When they trade with the goal of profiting from falling prices, it’s called going Short.
In all financial markets, when we want to close a trade (Long/Short), we must execute the opposite trade. For example, if you buy something today hoping it will be worth more in the future, when you want to close the trade (to take your principal plus profit/loss), you must sell it. Just like with gold, cars, etc.
Now, here’s what you need to know: when you close your Long trade by selling, this type of sell is not considered a Short. Instead, it is called a Sell to Cover. So, you enter a Long with the aim of profiting from rising prices, but when you close the trade, you’re actually executing a Sell to Cover.
The same applies to Short trades. Closing a Short requires buying, but this type of buy is not a Long — it is called a Buy to Cover.
So in the market:
- A sell done to close a Long is called Sell to Cover.
- A buy done to close a Short is called Buy to Cover.
All of this was explained so that you can understand how traders’ actions influence price movement, either upward or downward.
When you understand these effects, you can gain significant profits from the market.
Effects Summary
- Long trades directly cause prices to rise.
- Short trades directly cause prices to fall.
- Buy to Cover trades cause price to rise if combined with Long trades.
- Sell to Cover trades cause price to fall if combined with Short trades.
Did you notice the interesting point? Longs and Shorts directly affect price movement, just like in traditional markets where demand pushes price up and supply pushes price down. But Buy to Cover and Sell to Cover, although they are also buys and sells, do not by themselves move prices.
Why? Because in modern markets, only trades that involve real competition and persistence among traders to own an asset — even at worse prices — affect price movement. Closing trades (covering positions) do not involve such competition, so they don’t cause price moves on their own, unless they overlap with active Longs or Shorts at certain price zones.
Now you can see how mistaken it is to expect consistent profits in modern markets by relying only on outdated knowledge and traditional market beliefs about supply and demand.
If you’ve had any experience in stock markets or online trading groups, you’ve probably seen how people insist on supply-demand levels. But what era and what markets do their sources actually belong to? This is one reason many traders fail to grow. Worse, they try to sell these outdated ideas with flashy advertising to people learning international markets (like Forex). But due to the global settlement system, supply-demand in these markets doesn’t behave the way these so-called teachers claim. And that’s just one part of the story.
Although I explain this thoroughly in my video course on Sentimental Analysis, here I’ll only summarize.
Types of Trading Orders
Now, an amazing point: how are trades actually executed in the market?
In all financial markets worldwide — domestic or international — trades are always executed via Limit Orders.
Knowing this is critical for understanding price movements and making good trading decisions. Without a real grasp of this, consistent profits are just an illusion.
To understand limit orders, let’s first review pending orders.
Suppose your analysis shows that if the price rises above the current level and reaches your target number, it will continue upward. But you might not be at your trading desk at that moment. In this case, you can place a Buy Stop order.
- Buy Stop is used when you expect the price to continue rising if it reaches a certain level.
For falling prices, you’d use a Sell Stop.
- Sell Stop is used when you expect the price to keep dropping if it reaches a certain level.
Now, if your analysis suggests the price will reverse at a certain level instead of continuing, you use Limit Orders:
- Sell Limit: When you expect the price to rise to a point and then fall.
- Buy Limit: When you expect the price to fall to a point and then rise.
This is why all trades in financial markets are executed as Limit Orders. Even when buyers/sellers are willing to trade at worse prices, they still look for the best available price. Therefore, all trades are queued as limit orders, and price only moves if there’s persistence and competition among traders for worse prices.
Identifying Price Movements and Trends
From here on, you’ll learn how to identify the future direction of price.
As said earlier, Sentimental Analysis means analyzing trader behavior in the market. Your job as a sentimental trader is to:
- Identify which types of traders (institutional, professional, retail) are active.
- Assess how much liquidity they bring.
- Determine their direction (buying or selling).
- And most importantly: decide whether it’s still the right time for you to enter.
This last point is critical. Many traders lose because they enter late — after a strong trend is already underway — only to see price stall, reverse, or drag them into long, unprofitable trades.
So, more important than spotting the trend is knowing how long it will last, and whether your entry is timely, or just providing an exit for earlier traders to take their profits.
Even when large players are strongly buying and pushing prices to new highs, you must ask: how long will this continue, and will it still be profitable for me to enter now?
Definition of a Trend
A trend is a condition in which price follows a clear direction. Traders must follow that direction and make decisions by analyzing signs of liquidity flow.
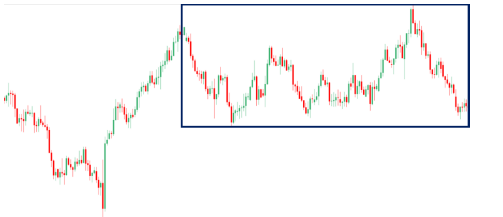
There are three main types of trends:
- Uptrend
- Downtrend
- Range (sideways)
As shown in the chart, price behaves in a range during the blue-marked zones.
How Trends Form
In the world, nothing appears suddenly without a beginning. Everything has a start and a gradual process of development.
Think of a tree: it begins as a small seed, slowly develops, and eventually grows into a large tree.
The Beginning of a Trend
A trend in the market never starts with an initiator; rather, it always begins with a movement. In other words, before any trend forms in the market, there must first be a movement.
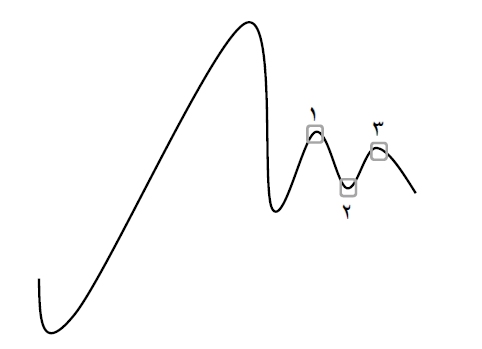
Each movement itself is composed of two smaller parts:
- A strong impulse leg
- A weak correction
For example, when an uptrend is about to start, the market first needs a strong upward leg followed by a weak correction. The combination of a strong leg and a weak correction is called a movement.
A Key Insight (Sheppard’s Note)
There’s a very important concept you must understand: applying this principle will eliminate many human bias errors and significantly impact your trading results.
When you observe the first part of a movement, you see a strong upward impulse. In the second part, you see a weak correction. Together, these two parts make up a movement.
But here’s the key question: Why must every movement contain both a strong impulse leg and a weak correction?
Think back to Sheppard’s table example and Richard H. Thaler’s advice to “think about the real world.” In reality, you cannot conclude that a trend has started simply by seeing a single strong leg.
What you initially see may not reflect reality. After spotting a strong leg, you must also wait for a weak correction before confirming that it is a movement.
The Rule of the Ideal Correction
A very important rule: the correction of a strong impulse leg should not exceed 50% of the leg’s length.
- If buyers’ strength is 100, then sellers’ strength must be less than 50.
- This means the market’s money flow still leans toward buying.
When this happens, the correction is considered ideal. An ideal correction is defined as a retracement of less than 50% of its preceding strong leg.
The Logic Behind It
No trader can ever “read the hand” of institutional traders. These professionals have spent years (about 5 years of costly, highly specialized training) to become institutional traders, market makers, or liquidity providers. Believing that we can predict their moves is an illusion—just like the illusion in Sheppard’s table or the deer-in-the-road example.
So what should we do?
We must look for uninformed and trapped traders. Their actions and reactions in the market are easy to identify. This is explained by the Contrarian Theory.
According to this theory, if you want to succeed in a particular community (e.g., the stock market), you must observe how the majority behaves and then act in the opposite way.
Since 90% of traders fall into traps and only 10% succeed, by identifying the trapped traders (those creating weak corrections), we can deduce that the strong leg was formed by big players—the successful 10%. Therefore, we should trade in the direction of the strong leg, opposite to the weak correction.
Summary of This Core Concept
We look for strong impulse legs and weak corrections in the market because:
- We can never read the institutional traders, but we can read the trapped ones.
- According to contrarian theory, since the trapped traders make up 90% of the market, acting against them aligns us with the successful 10%.
So, to identify a trend, we must first identify a movement, and to identify a movement, we must look for a strong impulse leg followed by a weak correction.
Continuation of a Trend
As long as the cycle of a strong impulse leg and a weak correction keeps repeating, the trend continues.
- In an uptrend: repeated strong upward legs followed by weak corrections mean the uptrend is ongoing.
- In a downtrend: repeated strong downward legs followed by weak corrections mean the downtrend is ongoing.
Thus, the continuation of a trend—whether upward or downward—is signaled by the repetition of strong legs and weak corrections.
Ending vs. Reversal of a Trend
It’s important to distinguish between the end of a trend and a trend reversal:
- End of a trend: when the last significant swing low (in an uptrend) or swing high (in a downtrend) is broken, the trend has ended. But this does not necessarily mean a new trend has begun.
- Reversal of a trend: when a new strong impulse leg and weak correction form in the opposite direction between the last effective swing low and swing high, it signals the start of a new trend.
So:
- Breaking the last swing low/high = end of trend.
- Strong opposite movement within swing boundaries = trend reversal.
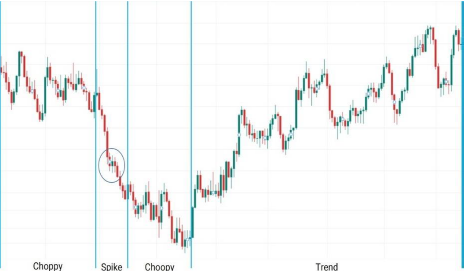
Range-Bound (Sideways) Trends
When the price forms three swings within the last two effective swing points, a range trend has formed. There are two types:
- Sideway Range:
- Price moves horizontally in a clear, tradeable manner.
- Traders can buy at support and sell at resistance.
- There is enough liquidity, but no clear directional drive.
- Choppy Range:
- Price moves in a messy, irregular way.
- No tradable behavior, as there are no clear swing highs and lows.
- Happens when market liquidity is very low.
- Professional traders avoid this market.
Ending a Range Trend
For both Sideway and Choppy ranges, the end of the range comes when a strong impulse leg followed by a weak correction forms in one direction. That signals a breakout and the start of a new trend.
Identifying and Drawing the Price Movement Framework
So far, you’ve learned how to identify clues that give you information in real time—information that others don’t yet have. This means you’re already at least one step ahead of the crowd.
Remember: in today’s world, wealth belongs to those who have earlier and stronger information than others—not necessarily more knowledge or more money.
Now we move to another crucial subject: the price movement framework.
The price movement framework is essentially like the map you use when traveling to your destination. After learning this concept and how to properly identify it, you’ll be able to clearly know:
- Where exactly you are in the market right now.
- What you should do.
- What type of trade you should look for.
- What the best action or decision is at this moment.
- How to manage your open positions.
If you’ve spent some time in the markets, you know that simply answering these questions is enough to make someone a professional trader.
The “Yawn” Principle
There’s a golden and simple rule called the “Yawn.”
If you think you might one day forget this principle or not take it seriously, write the word YAWN in big letters on an A3 sheet and stick it on the wall of your trading room, right where you’ll always see it while trading.
Not respecting the Yawn principle is the reason behind a very high percentage of traders’ losses.
But what is the Yawn? Let me ask you: if you yawn in the middle of the day, do you instantly fall asleep? Of course not. Why? Because before sleeping, each of us follows a set of principles or routines—maybe going to bed at 11 PM, taking a walk beforehand, reading a book, etc.
In other words, for even a simple action like sleeping, we naturally check the time, the place, and the conditions before doing it.
Trading works the same way.
When you open your chart, you shouldn’t immediately look for an excuse to enter a trade. Entering a trade has its own principles and rules. Following them leads to consistent and significant profits.
Before entering, you must ask: is the price currently in the right time, place, and condition for a trade?
To evaluate that, you need to know how to identify the price movement framework.
Where Are We in the Market?
First, we must evaluate where we are right now in the market. Are we even in a zone where it’s legitimate to look for trades? Is there enough liquidity in the market? Are the major players active at this time?
Once we answer these questions, the next step is to decide: should we be looking for a buy trade or a sell trade?
For example, we should never look for a buy trade when price is close to a tension zone, even if indicators, oscillators, or technical patterns suggest a good long entry.
That’s because near tension levels, where many orders are clustered, price has the potential to move against our expectations, causing losses.
So, before taking any trade, we must be sure the current market location is suitable for buying or selling.
Another key question: if we do enter, where should we place our stop-loss? How far should we expect price to move in our favor?
If there’s a large distance between our entry point and the first real barrier that could shift order flow against us, then there’s no reason to set a small profit target—regardless of Fibonacci levels or chart patterns.
This explains why many traders take profit too early, celebrate briefly, and then regret later when price keeps moving far beyond their exit.
The solution: learn how to identify your current position in the market so you can make the right decisions for both entry and exit.
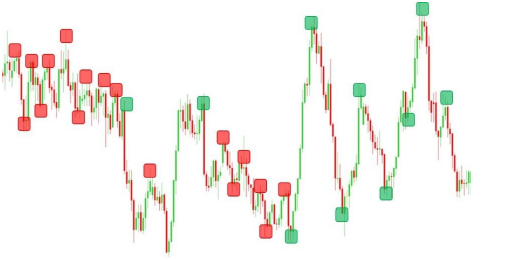
The Effective Swing
To draw the price movement framework, you first need to understand the concept of an effective swing.
- A swing is any turning point in the market.
- An effective swing is a swing after which price makes a significant move.
Red rectangles in the chart mark ineffective swings, while green rectangles mark effective swings.
Notice: after effective swings, price makes strong moves. This shows the presence of money flow and liquidity, and highlights their importance. After ineffective swings, however, price shows no significant movement—meaning liquidity is low and big players are absent.
Our goal in identifying effective swings is to follow the trail of big money, so we can trade in the true direction of the trend.
You’ve probably heard the saying: “The trend is a trader’s best friend.” This becomes true only when, as Richard H. Thaler emphasizes, you look at the important underlying realities—following the footprints of institutional money rather than chasing signals from indicators or chart patterns.
Key Levels
Key levels are those effective swings where price has the potential to react strongly and shift direction.
When price reverses sharply at a point and an effective swing forms, it shows that—for reasons we don’t need to know—that zone is important to institutional traders. Note: it’s not a single “point,” but rather a range.
That’s because traders don’t all act at the exact same price. Different risk tolerances, behaviors, or even technical issues (like delays in execution) mean that orders cluster across a range.
When drawing key levels:
- Use effective swings.
- Draw a zone that captures the densest overlap of price action at the end of the swing.
- Don’t obsess over precision. The goal is simply to mark a zone where price is highly likely to react.
The Price Movement Framework
Price usually moves between two effective swings—one above, one below current price. To draw the price movement framework, simply connect the key levels of these two swings.
Whenever price breaks out of one of them, identify new effective swings and redraw your framework.
This framework filters out unnecessary trades and gives you clarity:
- What exact actions to take right now.
- How to maximize profit or minimize loss.
- Whether to enter a trade at all, and how to manage it once inside.
By focusing only on the most important two key levels, you eliminate distractions and psychological traps that cause many traders’ losses.
In most cases, where others are looking to sell, you will be looking to buy – or vice versa. Unlike them, you won’t suffer or feel upset when the price changes direction after you’ve entered a trade. Instead, that change in direction is exactly what they could not have imagined in the very recent past – but you were fully prepared to take advantage of it.
As you progress further in this book, you will increasingly realize the simplicity and power of sentiment analysis. You will be able to experience peace of mind while trading, alongside gaining the highest profits in the market with the least possible loss.
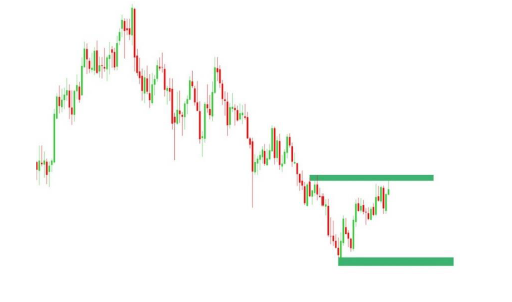
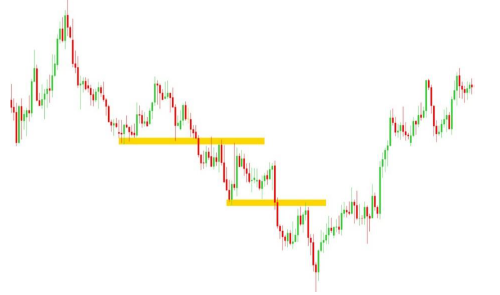
Golden Levels
Another type of key level in the market exists, which makes your trades enter profit with much higher probability – these are called golden levels.
Take a look at the image below:
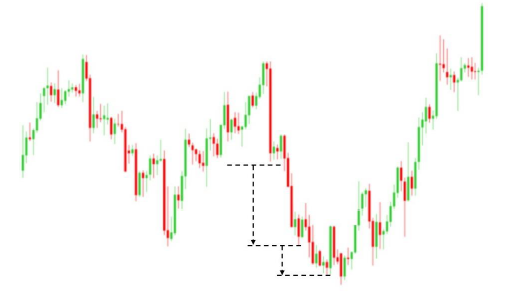
Consider the price at point 1, where it formed a significant swing followed by a sharp rally. If we mark the yellow area as the key level of this swing, we can see later that, after a decline, the price broke this level at point 2. Then, given the strong bearish leg that occurred, the price corrected back to this same level.
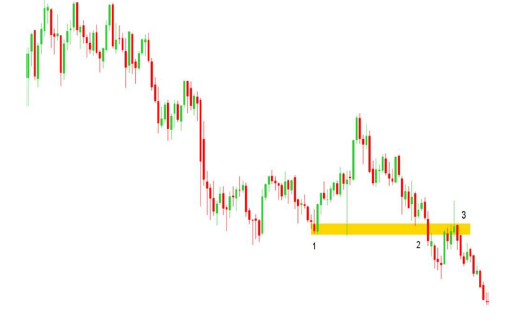
At this point, it is said that a phase shift has taken place, and we call this a golden level.
The credibility of golden levels is far greater than other levels, and you will later learn how to use them for entering the market and making profit.
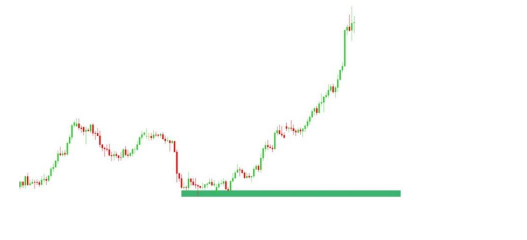
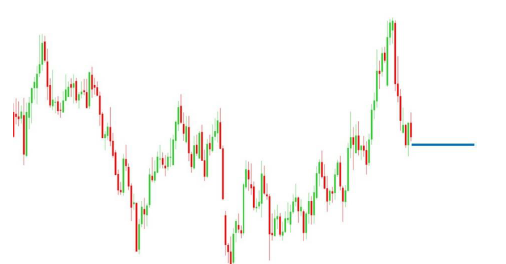
Here is another example:
In this image too, you can clearly see the reaction of price after breaking a level, and then its meaningful response when it returns to the same level.
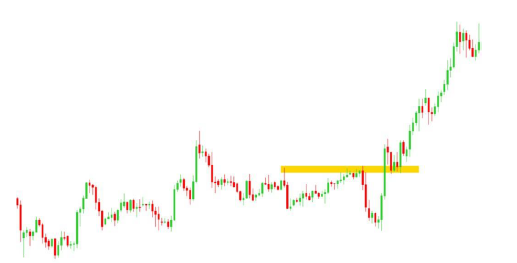
It is very important to know that a golden level is often the zone that institutional traders use to get better average entries and accumulate larger positions.
They know that many traders have identified the current tension level and are planning to trade in that area. So institutional traders create conditions that encourage retail traders to take trades in the direction they want – allowing institutions both to secure better entries and to accumulate larger volumes.
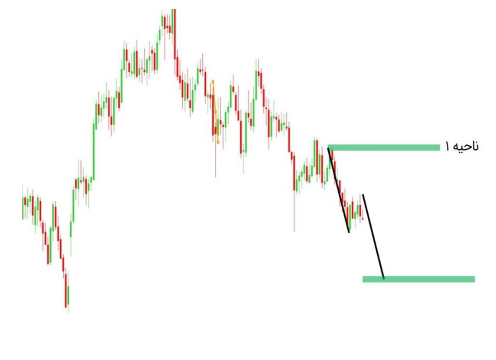
Now, suppose you want to draw the price movement framework. Looking carefully, you’ll notice that price is not between two effective key levels – it is only above zone 1, with no key level ahead.
When you cannot find a key level ahead of price, you must not force one by scrolling back in history or zooming out on the chart. This is a serious mistake.
In sentiment analysis, you analyze and trade based on the current market, not its past.
Here, you simply apply the movement rule (or “step distance”).
The movement rule reflects the expected or target price movement for the future, as set by large traders according to their strategies.
To identify the next target of price movement, you just measure the distance it has already moved. Simply draw a line showing the current price move, copy it, and place it at the tip of the last swing. The end of this line is where price, after moving the same distance, is expected to react strongly. At that level, you mark it as a key area for decision-making.
So when no clear level exists ahead, you simply project the last step’s distance to estimate the next effective level.
The Logic of the Movement Rule
The length of price steps represents the expectations and targets of large market participants.
Think of a wholesaler who dominates a specific product in a city. By evaluating similar products, supply and demand, and popularity, he knows up to what price level is acceptable to the public – whether up or down.
Big traders in the market act in the same role.
They set how far price should rise or fall based on market demand, supply, and financial policies.
They assess the market’s capacity: if price rises 100 units and traders accept this new zone, they conclude that another 100-unit move is also sustainable. This has nothing to do with Fibonacci levels or indicator signals.
Professional traders measure the psychological and financial tolerance of market participants and set their targets and expectations accordingly.
That’s why we say that the step distance of price is essentially the expectations and goals of the big players.
Identifying Financial and Psychological Persistence of Traders
A critical subject is measuring the persistence (stubbornness) of traders, both financially and psychologically, in trend and counter-trend positions. This provides valuable clues about whether a trend will continue or not – before it happens – giving us an edge over other traders.
As I mentioned earlier, the key to consistent profitability in trading is not only aligning yourself with the big players, but also obtaining meaningful information earlier than others. This topic helps you detect those valuable clues.
Always remember: we must trade in line with the big money and the influential traders. Otherwise, we’ll end up with the trapped traders, who are manipulated by price movements.
By analyzing persistence clues, and applying contrarian theory, we can determine in which direction the effective traders are moving.
Contrarian Theory Reminder
Contrarian theory says: if you want to succeed, study what the masses are doing – and do the exact opposite.
In financial markets, the majority are the ones constantly losing. The minority, with deep knowledge and skill, are the successful ones.
Since we cannot read the minds of the elites, what should we do?
Simply follow the contrarian principle: act against the losing traders, and you’ll naturally be aligned with the market movers.
For example: if you know that sellers are showing more persistence – financially and psychologically – than buyers, your chances of success in selling are much higher than without that information.
Four Clues to Identify Trader Persistence
Once you learn these four clues, you’ll be able to tell in under 10 seconds whether you should buy, sell, or stay out. Then, your next step will be to pick the best entry point – which you’ll also learn later in this book.
So simple!
Do you still think you need indicators, oscillators, or traditional technical analysis tools?
Isn’t it time to become a professional trader with the right mindset?
Let’s get to the four clues for identifying the persistence of influential traders.
Clue 1: Measuring Price Step Distances
Look at the image below: the arrows show the distances price moved in each step.
Take Step 2 for example: entering a buy trade at the blue arrow shows that persistence among traders remained strong, as price continued upward with new liquidity. This signals that the major buyers are still in the trend – so further buying is justified.
As a result, Step 3 extended even further due to accumulated new entries.
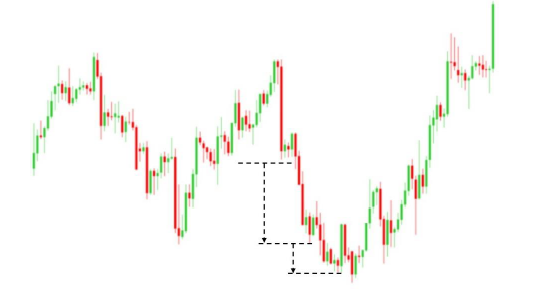
But in Step 4, the distance shrinks. This means large traders are no longer making significant purchases. With reduced persistence, the move weakens.
So when the main players stop buying, why should we enter long – no matter what indicators, patterns, or social media signals suggest?
The big players don’t rely on these tools. Why should we?
This clue is called the Liquidity Persistence Variation Index in trend direction. It helps you measure the current state of influential traders’ commitment to building the trend.
Example: Downtrend Case
In the next image, the red and blue arrows show the slopes of price steps – blue for bearish legs, red for bullish pullbacks.
Clearly, the bullish steps each time had less slope (or no change), showing buyers’ persistence was weakening. That means buying here is unwise, since even the creators of bullish moves are not fully committed.
Meanwhile, the slope of the bearish step increased, meaning sellers are adding with stronger persistence.
So, what’s your decision? Isn’t it obvious that the sellers are the stronger side here?
Buyers
When buyers do not make significant purchases in the market, you also become a seller. Now, no matter what indicator or oscillator changes color, enters or exits overbought/oversold levels, or gives any signal, you will not be deceived. Instead of looking for a scapegoat with every loss—sometimes blaming a price bubble, sometimes manipulated economic data, or simply bad luck—you will stay rational.
Notice that it is not always necessary for both buyers and sellers to simultaneously change their psychological tendencies. Even if only one side is identifiable, it is enough for us. Of course, if both occur together, even better. Also, every step should be compared with the previous step, not with steps much further back—because of the historical memory of traders in the market.
Skewness of Profitability Utility:
A clue to identifying the financial and psychological persistence of traders
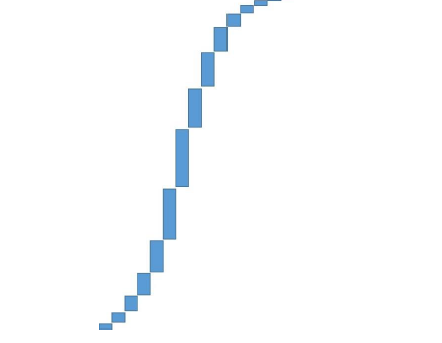
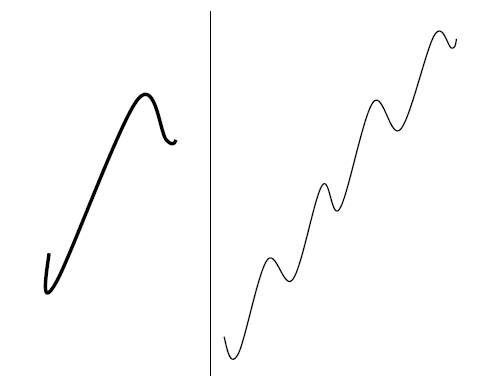
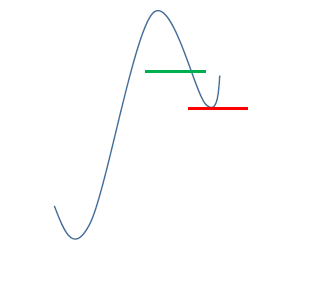
Now the final clue, which examines the skewness of price movement. Consider the two curves below:
The curves represent upward price progression in two different scenarios. Which curve shows price advancing at an increasing speed—left or right? If you were to enter a trade, which would you prefer to happen? Left or right?
Clearly, the left curve shows that price is advancing faster. To clarify, look at the slope of the two lines: which moves faster, the left or the right? Obviously, the left line, because it progresses more quickly.
In this fourth clue, what you are actually analyzing is the profitability utility index of a stock. That is, based on the skewness of its movement, does the price have the proper angle and sufficient momentum to carry your trade into profit?
At this stage, you can identify whether, in the present market moment, large and influential traders are increasing their investments and initiating a trend. Look at the chart below:
- In curve 1, you can clearly see the speed of price movement and its effective reaction to a higher timeframe key level. Notice the slowdown during the drop, followed by a price rally.
- In curve 2, again you see a slowdown in price movement, reaching a point where buyers no longer show willingness to invest, and no financial/psychological persistence is visible.
- Curve 3 shows the same situation again.
Another example is shown below: here, too, you can see the reduction in skewness of profitability utility.
Later in this book, you will learn how to trade using these states to measure the financial and psychological persistence of active market participants and generate income. Every concept here connects like links in a chain—you will gradually learn how to combine them and execute profitable trades.
Principles of Trend
As you learned earlier, a trend begins with a strong impulse move followed by a weak correction. As long as this pattern continues, we can say that the trend is progressing.
But a trend has three very important principles, which we will now cover. Mastering these three will help you make the best decisions in response to trend changes—maximizing profits and minimizing losses.
Principle of Trend Continuation:
This principle answers the question: How long will price continue moving within a structure?
According to this principle, price tends to reach the opposite boundary of its structure.
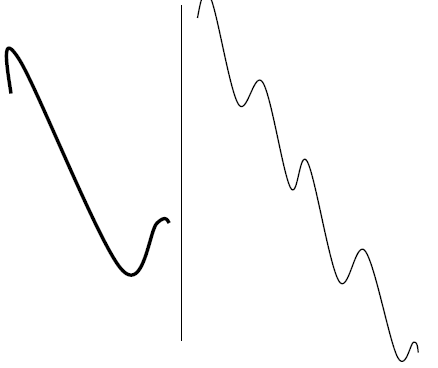
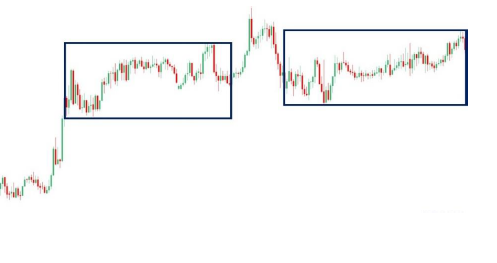
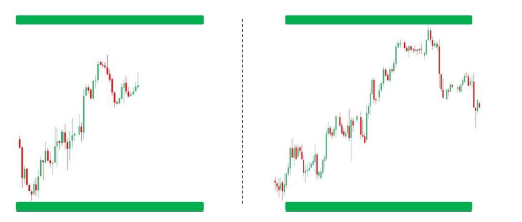
Principles of Trend Reversal:
So far, you have learned that based on the continuation principle, price tends to move toward the next effective level. But what must happen in the market for price to stop continuing and lose interest in reaching that level?
The answer is simple: a strong impulse move and a weak correction in the opposite direction of the trend.
Look at the chart below: in the right structure, you can see that after a powerful counter-move and weak pullback, price ended its uptrend and began a downtrend. This occurred after touching the upper level, but it could also happen mid-way.
In the left structure, price had not yet reached the upper level but still formed a strong opposite impulse and weak correction—showing the uptrend was over and price entered either a new opposite trend or a ranging phase.
Market Cycles
Did you know the market is composed of different cycles, each with unique characteristics? Knowing and understanding them helps you profit significantly.
A cycle is essentially a pattern of specific reactions price goes through, visible directly on the chart.
You already know two market cycles: range and trend.
- Range occurs in two forms: Sideway and Choppy.
- Trend occurs as either uptrend or downtrend.
We will now study these in detail and show how you can enter before a trend even starts.
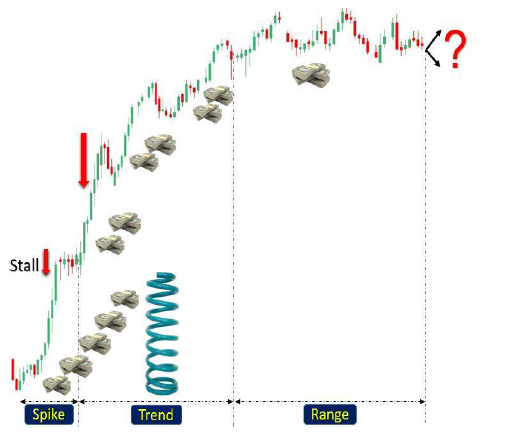
The Spike Cycle
The first cycle, called a spike, is shown on the left of the chart. Here, price makes a strong move and a weak correction, but the correction takes the form of a stall (a pause).
This means buyer strength is so high that sellers cannot create a meaningful retracement. This cycle is usually formed by large institutional traders with heavy capital, like energy released from a compressed spring. When a correction occurs, its strength prevents significant pullbacks.
When the spike cycle ends, professional traders with smaller capital notice the new trend and enter the market. Their smaller capital results in deeper corrections as the trend progresses, signaling reduced persistence.
Finally, retail traders enter late, adding very little capital. The market then enters a range cycle. After a range, any cycle may follow.
Key notes:
- The spike cycle shows huge momentum, identifiable by its stall correction.
- It marks the entry of large institutional traders.
- The trend cycle marks the entry of professional traders, with deeper corrections.
- The range cycle occurs when retail traders enter, showing reduced liquidity and persistence.
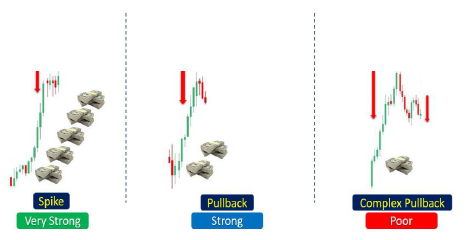
Identifying Trend Strength
So far, you have seen two types of corrections:
- Stall
- Pullback
There is a third type: the Complex Pullback.
In the chart, each correction type is shown with money stacks, indicating the strength of each move:
- Spike (institutional money): extremely strong, corrections are stalls, not pullbacks.
- Pullback: weaker than spike, allows counter-traders to push price somewhat.
- Complex pullback: weakest, multiple corrections occur, signaling diminishing momentum.
If price forms four swings without continuing, the market goes into a choppy range.
Types of Trading Opportunities
A trading opportunity is a set of conditions we must observe in the market to enter. This book covers four trading opportunities, each with unique entry points.
The first is stall, formed in the spike cycle. You’ve already learned that a spike’s correction happens through a stall.
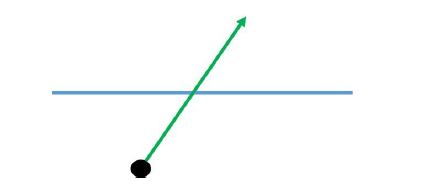
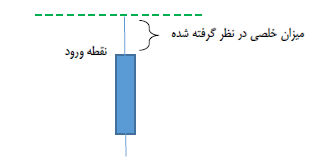
The concept of buffer space (خلصی) means avoiding entry too close to the edge. Instead, wait for confirmation before entering—this ensures higher probability of continuation after your entry.
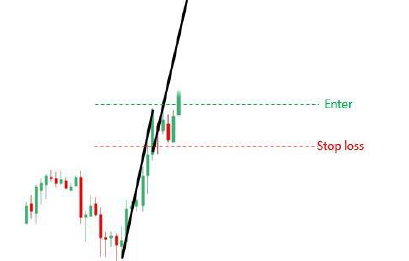
Look at the candlestick below: suppose your entry is just above the candle, marked with the green line…
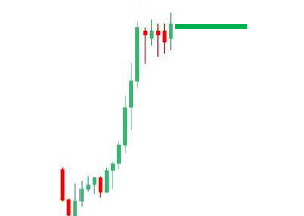
Entry (Decision to Enter the Market)
As is clear, from the top shadow of a candle, the order flow actually reflects whether the tendencies of the influential traders present in the market lean more toward a downward movement, upward movement, or neither (neutral).
Take a candle from the beginning of its shadow to the end of its shadow and divide it into three equal parts. If, when the candle is about to close (the candle’s color does not matter at all), the price closes in the top third of the candle, then with higher probability the next candle will move upward. If it closes in the bottom third, then with higher probability the price will move downward in the next candle. And if it closes in the middle third, then most likely the price will continue in a neutral manner.
We use this candle setup when we want to enter the market and identify trading opportunities—so that we experience the least capital stagnation and the highest probability of success in the trade.
Now, with this knowledge, let’s see where exactly the first trading opportunity—Stall—provides the entry point. Look at the figure below.
The empty space between the candle and the entry line is called Khalasi (“clearance”). We keep this clearance to increase confidence that the price will continue moving in the predicted direction.
- In timeframes higher than 4 hours, this clearance is equal to the thickness of the thickest line on MetaTrader (or other trading platforms).
- In timeframes lower than 4 hours, it equals Spread × 2. For example, if the spread is 2 pips, you must consider 4 pips of clearance.
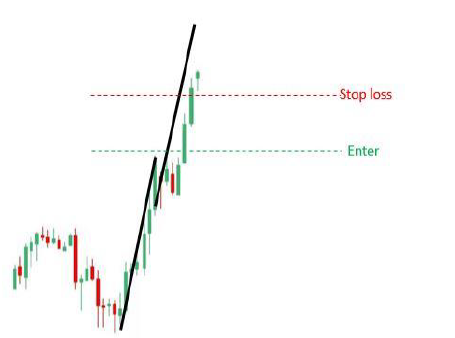
In this example, you can see a Spike cycle whose correction is in the form of a Stall, creating a trading opportunity that justifies entering the market. When you observe this cycle in the market, you can enter above the created top (with clearance) — shown by the green line.
Second Trading Opportunity – Pullback
This happens when, after the correction, the last candle closes in the top third. In that case, you can enter in the next candle with clearance. (See image below.)
Third Trading Opportunity – Phase Change
This happens when the price makes a meaningful reaction to a Golden Level. If, after this reaction, the last candle closes in the top third (in an uptrend) or in the bottom third (in a downtrend), you can enter the market.
As explained before, when price reacts clearly to a key level, we call that level a Golden Level. After such a reaction, if the candle closes in the top third, we can enter the market in the uptrend continuation.
So far, all mentioned opportunities have been trend-continuation setups, meaning you trade in the direction of the trend. But there is another type of opportunity where you trade against the previous trend and at the beginning of a new one. This is called a Test Opportunity. These setups occur more often in sideways ranges.
⚠️ Important Note: There is no specific training for this part. You can only trade these setups once you have fully learned and mastered Sentimental Analysis and have executed many trades using it. Experience shows that a trader who follows the correct method precisely as taught will eventually understand and be able to take reversal trades. However, even then, these trades are less frequent since their success rate is lower.
Reversal Trades
In reversal trades, the most important factor is the price’s interaction with a framework level and noticing the reduction in financial and psychological persistence of traders in the previous trend direction. As the price approaches such a framework level, its profit-yielding potential naturally decreases. Price movement becomes deeper but covers less distance and often falls into a ranging cycle.
That’s why you should only attempt these types of trades after gaining enough experience in applying Sentimental Analysis.
Examples of Trading Opportunities
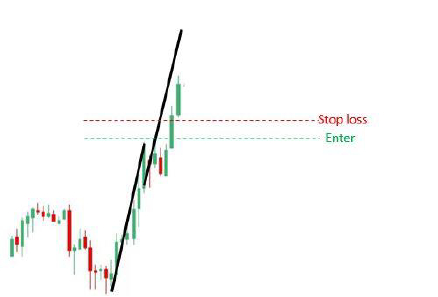
- Pullback Opportunity: After a strong move, a weak correction, and closing of the order-flow candle in the bottom third, we get a chance to enter in the next candle—provided price passes clearance and hits our blue entry line. ⚠️ Reminder: The correction should not exceed 50% of the total move; otherwise, you should not trade it.
- Test Opportunity: As explained earlier, these are counter-trend setups. For example, after a meaningful reaction to a key level and reduction in profit-yielding potential, if price closes in the top third of the candle, you can enter long with clearance.
- Phase Change Opportunity: As shown in the image, after price closes in the expected third, you can enter the trade. Phase changes are among the best and most profitable setups.
Actions Before, During, and After Trades
All trading actions fall into three categories:
- Before entering a trade
- During an open trade
- After exiting a trade
✅ Checklist Before Entering a Trade:
- Identify the effective swing and mark the price’s framework.
- Check for Yawning (market condition).
- Identify the current market cycle.
- Identify the type of trading opportunity (Pullback, Stall, Phase Change).
- Assess the financial and psychological persistence of traders (all 4 cases).
- Monitor the order-flow candle.
- Identify the entry point with clearance.
- Set stop-loss and take-profit levels.
- Determine position size and enter the trade.
If conditions are not favorable, move the instrument to the watchlist until a perfect opportunity arises.
Stop-Loss Placement
Stop-loss should be placed at a point where, if price crosses it, the probability of further loss is much higher and faster. For example, when many traders place stop-losses in the same area, their stops trigger, adding to opposite-side order flow and accelerating price movement against you.
Exit Strategy
Managing exits is the most important part of trading and actually very simple. The goal is to find the best exit point to secure maximum profit or minimum loss.
As you can see, the stop-loss is placed in a position where, based on the explanations given, if the price reaches that point, the probability of moving faster in the opposite direction increases. Therefore, we set the stop-loss there. However, for this setup we do not set a take-profit; instead, we let the price continue as long as it moves in our favor, and we follow along until the price eventually touches our stop-loss, which we have trailed above the entry line (profit zone), so that we exit the market with profit.
If you noticed, we have drawn two black lines here showing the price movement. The purpose of this is to define the framework of price movement so that we know in which area the price is more likely to make a correction to the current leg.
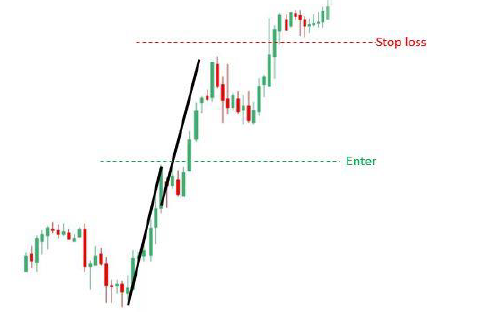
To continue with trade exit management, look at the chart below:
In this chart, you can see that the price has formed the next candle in the direction of the trend. At this point, after the candle closes in its upper one-third (which means market sentiment and order flow are still bullish), you can move your stop-loss below the last candle. Doing this means you are managing your trade exit candle by candle. As long as the candles close in the upper third during an uptrend, you keep repeating this until the price touches your stop-loss in profit and exits you from the market.
Candle-by-candle trade management is more suitable for 4H timeframes and higher. If you want to trade in lower timeframes, you should use swing-to-swing exit management. This means with every swing the market forms, you move your stop-loss below that swing (in an uptrend). In the example shown here, first we manage the trade candle by candle, and then we switch to swing-to-swing management.
As you can see, we moved the stop-loss below the last candle that closed in its upper third and are waiting for the next candle to form. Looking at the next chart:
The following candle also closed in the upper third, so according to the rule, we move the stop-loss below it. Now we wait for the next price move. Looking at the next chart:
The price has reached the end of its movement and is normally making a correction here. Knowing that price tends to correct before resuming, we move the stop-loss to the 50% level of the leg. That means if you measure the last upward leg, we shift the stop-loss halfway down from its end. The reason for 50% is that if price corrects more than this, sellers are likely as strong as buyers, and the chance of a deeper correction increases.
Continuing:
The price corrected exactly 50% of the leg and then continued upward, and now it’s correcting again. From here onward, with every new swing formed, we move our stop-loss accordingly, trailing behind the market until price eventually touches it in profit. As shown, we placed the stop-loss behind the last swing and are waiting for the price to continue. Next chart:
Here you can see price is touching our stop-loss and closing the trade in profit.
By using exit management without setting a fixed take-profit, you can maximize your gains and capture the largest possible move from your trade.
Trade Exit Models
However, there are different models for closing trades. Perhaps you are a trader who prefers less risk and wants to exit as soon as the trade is slightly profitable. In that case, you can use a fixed take-profit and set a specific target for every trade.
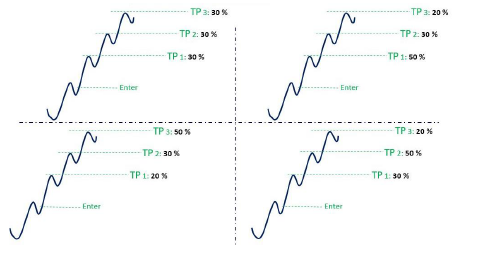
Or you may prefer to close part of your position at each swing. For example, look at the chart below:
In the first scenario (on the left), you could close 30% of your position at each swing, reducing the risk of a reversal wiping out your gains. Or you might choose to exit 50% at the first swing, 30% at the second, and 20% at the third. This completely depends on your personality, financial goals, and risk tolerance.
Up to this point, you have learned what actions to take before entering a trade and while a trade is open, and you are familiar with the checklist. Now let’s talk about what to do after a trade closes.
Trading Journal
At this stage, your checklist—just like before—has only one item:
✓ Record your trades in a trading journal.
But this single item is so important that if one day you don’t feel like filling out your trading journal, you shouldn’t trade at all. Look at the table below:
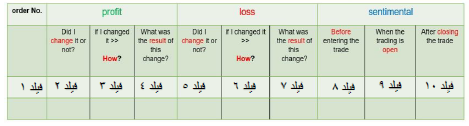
This table shows the key fields that must be included in your trading journal.
Notice there are no numbers like profit, loss, entry price, or exit price here. Because those are not the most important factors. What truly matters is how well you managed your psychology and emotions in each trade. Chapter 3 will be dedicated to trading psychology, but here, by filling out just these few simple fields and collecting screenshots of your trades, you can get a very precise measurement of your emotions.
This trading journal consists of four main sections: order no. / profit / loss / sentimental. These represent the trade number, take-profit, stop-loss, and finally your emotions during the trade.
When you place a trade, the broker assigns it a code for future tracking. This goes into field 1. Each of the profit, loss, and sentimental sections also contain three fields, reviewing your state at different stages.
For example, in the profit (take-profit) section, fields 2, 3, and 4 ask:
- Did you move your take-profit?
- Why did you move it?
- What was the result of this change?
In the loss (stop-loss) section, fields 5, 6, and 7 ask similar questions.
If you want reliable insights into your trading performance, you absolutely must keep a properly filled and organized journal, with screenshots of your trades.
By now, you know how to trade in the market, and how to use sentimental analysis to build consistent income. But there is still one very important step: achieving the mental and emotional readiness required for trading.
Trading Psychology
As a trader, you have two teachers.
The first is the person you learn trading knowledge from—someone whose years of experience you gain in exchange for part of the value of their knowledge.
The second teacher is the market itself.
But the market is stricter and more expensive. The smallest mistake in the market cannot be undone or forgiven, and can cost you energy, time, and money. Losses are an inseparable part of trading, and the only way to minimize them is to have two things:
- A solid, professional trading plan that combines power and simplicity. Sentimental analysis provides both of these advantages, and you will realize this after a few trades.
- Control over your decisions and emotions while trading. You can only succeed if you remain emotionally neutral.
If you’ve been journaling your trades for a while, go back and review them now—you’ll notice your most successful trades are the ones where your emotions were recorded as neutral during and after the trade.
Most traders who fail in this market—losing capital, energy, and time—do so because of emotional trading, also known as over-trading.
Over-trading refers to trades entered based on emotions rather than logic. This usually happens when a trader, after closing a trade, feels emotions such as greed for more profit or revenge against the market for a loss. This drives them into another immediate trade, trying to either make more or recover losses.
Such trades usually end in failure and can cause a trader to lose a large portion—or even all—of their capital. Even worse, if such emotional trades happen to succeed, they are extremely dangerous. Because this creates a positive feedback loop in the trader’s mind, reinforcing the behavior of revenge trading or emotional impulse trading after a win—leading them to repeat it again and again.


