


Chartical 2024
I kindly recommend that you read the foreword of this book with patience and attention before delving into its content.
In all species, including humans, the struggle for "survival" begins from the moment the first cell is formed. This means that when the sperm cell fertilizes the egg cell, forming the zygote, its efforts to survive through cell division, energy procurement, and other processes start completely involuntarily and physiologically. After birth, as our interaction with the external world increases and we get to know it better, our struggle for survival becomes more voluntary, though it continues subconsciously. Even at this moment, while reading this book, we are engaged in the struggle for survival.
When we shop, go to the cinema, read, eat, etc., although these are parts of our daily lives, the underlying priority, which operates "subconsciously," is still survival. When we go to a restaurant, we implicitly and subconsciously care about the health certificates of the restaurant and its staff. A health certificate implies that the establishment is supervised by the health department, meaning its food is safe and approved in terms of contamination, disease, and toxicity. While we don't consciously think about this, subconsciously, we consider that the food from this restaurant poses no danger to us. Similarly, when we consider the prices, whether cheap or expensive, we are consciously ensuring our "financial survival."
This means that the struggle for survival is our subconscious priority and takes precedence over everything else.
The person described above enters the world of trading; the fundamental issue remains unchanged, and the first thing considered is still survival. In everyday life and trading, survival is intertwined with security; we must maintain our security to ensure our survival continues. The level of security guarantees the chances of survival.
In trading, a stop-loss defines a range within which our security is maintained. This means that whenever we enter a trade, we are aware that, based on our analysis and review, the price is likely to move within this range, and we aim to profit from this price movement.
However, given the vastness of the market and the numerous factors influencing price behavior, the price might move beyond our control and contrary to our expectations after we enter a trade. The ultimate level of security is the maximum amount of loss we can endure without jeopardizing our overll safety. Although triggering the stop-loss can result in losses, sadness, or anger, the loss should not be so significant that it leads to emotional and aggressive trading or so much money lost that we cannot engage in subsequent trades rationally.
The maximum loss threshold beyond which our psychological, technical, and financial security is compromised is referred to as the "ultimate level of security" (stop-loss).
Now, we intend to enter a trade, which means we expect to make a profit. As normal and healthy individuals, we do not aim to lose money in our trades. It's important to note that the pursuit of a trading opportunity begins with the intent to profit, and the rules and techniques of trading must be considered. However, if the desire for profit overshadows the market reality, real price movements are ignored, and driven by our dreams of profit, we may fail to recognize sufficient and real signals for entering a trade. This would result in an unsuitable trade (by suitable, we mean a trade aligned with price movements) because the foundation of this trade is based on impaired or inadequate reality testing. Often, in such cases, we engage in denial, rationalization, justification, and so on.
The manifestation of such an approach is when we start bending our trading rules. This means entering a trade despite ignoring the reality and the unsuitability of the trading opportunity. Here, the importance of "reality testing" becomes clear. The better our reality testing, the more appropriate our trades will be in alignment with actual price behavior.
Continuing on, when entering a trade, the volume of the trade must be considered. It should be selected in proportion to our capabilities and conditions, just like other daily activities. The volume should be appropriate to our assets and our ability to efficiently tolerate and accept the situation, whether we observe a large profit without getting overly excited or whether we incur a loss and need to work on recovering from it. Additionally, our account capital should be able to withstand such a loss to enable us to engage in subsequent trades.
Therefore, the greater the alignment with the "principle of reality," the more successful we will be and the more profit we can achieve.
After entering a trade, we reach a stage where we must decide whether to exit the trade or to hold onto it. If the decision is to close the trade:
- Is this decision made because we want to taste a profit beyond our capacity?
- Are we experiencing a small loss and cannot tolerate it?
- Have we entered a loss zone and realized that we made a wrong trade, but we do not want to admit our mistake, so we wait for the price to return to the entry point before exiting?
- Is closing the trade in line with our exit strategy and backed by rational thinking?
- Is the trade being closed due to excitement and psychological arousal, indicating a lack of "emotional control"?
The more our exit from a trade aligns with managing the tensions caused by emotions, the more it corresponds with proper management and exit strategy.
Given that the greatest teacher in trading is the market itself and the language of the market is the trading journal, it is essential to log the journal after exiting a trade (in Chartical, journal analysis is performed through artificial intelligence). By keeping a trading journal, we become familiar with our mistakes and strengths in trading. Just as a teacher must communicate with their student using a common language, a professional trader learns from their teacher—the market—through journaling.
By becoming more acquainted with our personal trading characteristics, we strive to correct our mistakes and strengthen our abilities. We also assess whether we are reinforcing our strengths or becoming overconfident and heading towards a downfall. Through this process, we understand the reality of our decisions and reactions in various market situations and gain a better grasp of where we excel.
It is through "accepting realities" that we work on enhancing our strengths and addressing our weaknesses.
Furthermore, creating and optimizing a trading plan based on the acceptance of the realities mentioned above fosters continuous growth. "Continuous growth" is the best description for a trading plan, as acknowledging our flaws and strengths helps us determine which time frames, symbols, and other aspects are suitable or unsuitable for us. By accepting these realities, we trade with greater confidence in ourselves. If a trader's personality is shaped in this manner, they will not be disheartened by two negative trades, nor will they idolize themselves over two positive trades; this is "self-esteem."
Self-esteem means loving our trading personality despite all its flaws; it is dear to us. We strive to nurture it and will not question it because of two negative trades. It is not an idol, and we will not turn it into one with two positive trades. Day by day, we will work towards growth and the development of our abilities.
Trading, like other specialties and human behaviors—such as driving, cooking, choosing a spouse, parenting, and so on—stems from a single personality, which is the trader. Just as all of an individual's behaviors must be based on the principle of existing reality, this principle must also be considered in trading. We must remember that the further we stray from the principle of reality, the more we will have to pay for it. All the topics in this volume are based on and presented according to this principle.
In conclusion, our journey in trading continues from "maintaining survival security" to enhancing "self-esteem," and this cycle will repeat throughout our trading life.
Wishing you ever-increasing profitability, both mentally and financially.
**Introduction**
I, Ahmad Reza Jabal Ameli, am writing this book at the age of 40, and like you dear readers, I am one of the millions of enthusiasts of the market and the world of trading.
Twenty years ago, I fell in love with and was drawn to this profession by recognizing the advantages of trading. Today, I enjoy it even more than before. This increased enjoyment comes from the past nine years during which I have been teaching alongside my own trading activities. Every day, witnessing your happiness and satisfaction from the profits you gain through my guidance, I feel a greater sense of accomplishment. Each time you profit, I share in your joy and satisfaction.
Unlike my previous books, this volume is written entirely by me, and every line is infused with hope and love for your increased profits.
The method and style of teaching in this book are significantly different from my previous works. This book is structured based on my nine years of teaching and live coaching experience, which now exceeds 10,000 hours. The feedback from you over these nine years has helped me optimize this structured approach.
From the outset, I emphasize that the greatest teacher in trading is and always will be the market—an extremely strict teacher, indifferent to the trader's circumstances. I continue to learn from the market and will not hesitate to share my insights with you. Whenever you feel the need for my assistance, I will be there for you.
In this book, along with teaching Chartical trading skills, I will also introduce you to the specialized trading assistant tools provided by the Chartical super artificial intelligence. These tools will significantly impact the quality of your trades and can easily be accessed through the Chartical cabin.
**Dedication and Acknowledgments**
Dedicated to my wife, "Shokoofeh," my eldest daughter, "Helena," and my youngest daughter, "Ronika." Without their love, support, and patience, this book might not have existed.
**"Every action has a reward, and every deed has a consequence."**
(Hafez, may he rest in peace)
Ahmad Reza Jabal Ameli / February 2024
**The Roots of the Chartical Trading Method**
In this book, you will become practically acquainted with the characteristics and rules of efficient markets and behavioral finance, which form the foundations of trading knowledge. The Chartical method is precisely based on these foundations and is entirely derived from these principles.
Chartical is not a strategy or trading method; therefore, a trader does not need to change their strategy or trading method after learning Chartical principles. Chartical is the art and skill of trading. Through learning and using Chartical, the trader merely enhances their trading skills and continues to advance their activities in the financial markets with their chosen strategy and trading method.
Richard Demille Wyckoff, known as the Legend of Wall Street (a wealthy stock market trader, prominent technical analyst, expert in behavioral finance, head of a trading desk at a Wall Street bank, founder, and editor of the Wall Street Journal), was the first in the world to combine "trading experience, behavioral finance knowledge, principles of technical analysis, and his observations on how order flow changes affect prices." In 1908, he founded trading with a blank chart and named it "price action."
He was the first to propose trading based on the behavior analysis of "influential traders present in the market" and taught it for nearly 15 years. Unfortunately, due to the scattered nature of his notes and educational materials, and the lack of sufficient effort by instructors, the method of trading with a blank chart (price action) was distorted over time. Today, it is sometimes mistakenly categorized under technical analysis (classical finance), where indicators or technical patterns are used.
**The Foundation of Chartical Trading**
In my sixth year of trading, I stumbled upon trading with a blank chart, and I earnestly pursued scientific research on price action. By gathering the materials of experts like Richard Wyckoff and integrating them with contemporary knowledge of behavioral finance and my own trading experience, I founded and introduced the Chartical trading method in my eleventh year of trading. Initially, I chose the name "Sentimental" for this method, which I later changed to "Chartical" due to its resemblance to specialized terminology in psychology and its alignment with musical concepts, reflecting the method's organization, harmony, and coherence.
Throughout history, both scientific and pseudo-scientific content have circulated in all fields, specialized and non-specialized alike. A lasting statement acknowledges its authenticity and relies solely on scientific and unbiased methods. My efforts over the years have been based on this principle, believing that just as individuals must achieve independence and self-sufficiency in their personal growth, trading charts must also be analyzable independently, without relying on indicators or any other tools. This is the fundamental and essential principle of Chartical: trading with a blank chart.
The Chartical method is precisely based on the theories of Richard Wyckoff and is free from any distortions.
Be aware that any method claiming to be based on price action or Chartical (formerly known as Sentimental) but mixed with indicators or patterns is erroneous and only leads traders astray in the market.
"The only source of Chartical is this book, and I kindly request all esteemed teachers to recommend the acquisition of this book as a teaching resource to their students due to its free availability. Personally, I will provide 'teaching and support for instructors' for free. Chartical.com"
"The nature of the market:
Naturally and logically, whenever we decide to enter and engage in any business, we must first fully understand the nature of its foundation; if this information is not sufficient or accurate, success in it can never be achieved, as we fundamentally do not know what choices lead to success.
What real people know does not have reality. This principle, from Plato to Richard Taylor, still stands, and various analogies have been made throughout history. If you have not been able to find an effective tool (indicator-oscillator), analysis method, or trading method to profit in your trading so far, it is for this reason. Here I want to address this very issue. Financial markets are beyond any trader's thinking and understanding. It has no emotions and is not merciless. It is indifferent but orderly. The market consists of a large community of buyers and sellers and has maintained its undeniable dynamism and efficiency on this basis. The market is unpredictable; large, orderly, and beyond any human emotion and understanding.
An environment in which something (stocks, indices, commodities, currency pairs, cryptocurrencies, etc.) can be traded by participating traders is called a market. The two main characteristics of the market are:"
1. Efficiency
2. Dynamism
1. Efficiency:
According to the principles of behavioral finance, which is currently the leading trend in modern economics, an efficient market is referred to as a market that, due to its specific characteristics, provides maximum security, price stability, and high capacity for traders.
Characteristics of an efficient market:
- High liquidity, which leads to the insignificance of the behavior of specific groups or categories of traders on price movements.
- High speed in disseminating and influencing financial information and reports on price movements.
- All relevant and effective information is reflected in prices.
- All traders use the same information, although each has their own method for analyzing the information.
Efficient markets come in various forms. The markets in which we trade are strong, informational, and operational. More information in this area is not necessary for our work, but if interested, you can refer to scientific sources.
Due to the efficiency of markets, price behavior is always changing over different time periods, and one must learn its language to always be successful with the help of this ever-effective teacher. The prominent feature of the Chartical trading skill is its market language; for this reason, it never expires, being effective in all markets, symbols, and timeframes. Just understanding the principles of Chartical is enough; trading is simpler than you think.
It is important to remember that by considering the nature of the market, one should choose and use an appropriate method. The financial market is like personal life: large, organized, and unpredictable. A large volume of information is being transferred in our daily lives. Political, social, and interpersonal events are constantly happening throughout the day, all of which affect each other and lead to subsequent events and decisions. Even human discoveries and inventions entail a large amount of information but are organized and systematic.
Another characteristic of the market that one should always keep in mind is its disregard for the trader's conditions. It doesn't matter to the market whether you were an elite student in university, an entrepreneur, wealthy, poor, faithful, or if you entered this profession out of compulsion. Regardless, the market moves ruthlessly and without regard to any of these factors or anything resembling them, and it is the trader who must always protect themselves and their capital in the market and constantly strive for self-improvement.
The term "improvement" refers to continuously acquiring skills to become more experienced, skillful, and knowledgeable as a trader. That's why I always hold trading coaching sessions on the Chartical website.
2 - Dynamism:
The reason for the high capacity of the market and the abundance of trading opportunities is that due to the very high volume and number of transactions in efficient markets, price volatility is very high, and there are always opportunities for trading.
Every piece of information, whether in personal and individual dimensions or in political, social, and international dimensions, serves as the basis and stimulus for making future decisions and ultimately shaping various financial, political, and social situations. The market is no exception to this rule, and the basis of all its principles is this principle of dynamism.
In this book, you will learn how not to fall into the trap of false opportunities and how to use efficient tools to prevent falling into traps and address such issues.
The nature of trading:
Success in trading requires four essential principles: technique, psychology, skill, and financial management. The absence or weakness in any of these factors significantly affects the likelihood of a trader's success. In this book, we will thoroughly learn the principles of technique and skill. It is emphasized that learning is not limited to reading the book or watching instructional videos; acquiring skills requires more importance and sensitivity. Chartical coaching and trading sessions are continuously held on the Chartical website for this purpose.
The principle of psychology will also be addressed through live Chartical coaching sessions and can be utilized if needed. The nature of trading is alluring. Making profits from the market is simple, meaning it's not complicated (if someone had told me 20 years ago that making profits from the market is this simple, I wouldn't have believed them), but that doesn't mean it's easy. Trading and making profits from the market are simple but difficult; pay attention to the concepts of simple-complicated and easy-hard.
With Chartical, you will see how trading and making profits are straightforward, but now I want to address its challenges.
Chances are, like me, you've been drawn to the allure of trading by:
- Being your own boss
- Having the freedom of location
- Having the freedom of time
- Relying on your own talent
- Being independent of bureaucratic red tape to obtain various licenses.
But you should know that being your own boss can lead to not adhering to trading plans, trading checklists, and past experiences, and without being aware of its process, this same advantage can covertly result in significant losses.
We may be our own boss in trading, but that doesn't mean our work is lawless; no one commands us laws, but we must rigorously enforce the rules we have set for ourselves for success in trading, even tougher than an external boss. Although self-management is much harder than management from external environments, a trader, by choosing trading as their profession and entering it, implicitly accepts this fact. Whether we like it or not, as long as our business is with the trading world and financial markets, we must embrace this self-discipline. Every step taken in this path is accounted for by the trader; even taking a step without action is accounted for.
The choice of location for trading is up to us, but is every location suitable for trading?
- While traveling
- At a party
- During leisure time
- In a means of transportation (car, train, bus, metro)
- At work, where focus may be insufficient
Be vigilant because this advantage (the choice of location) is very tempting and often portrayed by profit-seeking individuals. These individuals, driven by their own personal interests, use this advantage deceptively, but if you have some experience or look at the issue logically, trading is one of the toughest professions in the world that requires sufficient concentration, and that's not always possible in any location.
Is it a suitable time to trade when you're not mentally prepared, experiencing physical fatigue (even from a lack of sleep the night before, a cold, or a simple headache), or when the desired market is closed or at inconvenient hours (late at night, banks closed)? Is this a suitable time for trading?
Being able to generate income commensurate with our talents and abilities and not limited to fixed wages or salaries is excellent, but will this talent and capability also be effective in trading?
Is being an academic elite, having a university degree, being an entrepreneur, being wealthy, and other such factors, even from a spiritual perspective, reasons for success in trading? No, because trading has its own unique set of talents and personal and environmental conditions.
In this way, regardless of who you are and what you are, you should immerse yourself in the world of trading with sufficient knowledge of the nature of the market and trading, learn from a scientific educational source, and enhance your skills with the help of a more experienced and familiar mentor in this environment.
In the end, you must reach a level of knowledge and skill where you can trade semi-consciously like other daily activities (such as driving, walking, cooking, catching falling objects from a table, etc.). Exactly the same roadmap you have used for success in other aspects of your life.
The fundamental nature of trading is to adapt to the principle of reality. A double-edged sword. The confrontation between life and death, independence and dependence, emptiness and purposefulness, etc. All these issues depend on the trader's decisions during trading behavior, and the trader must remember at every moment that everything in this world has its cost, even not wanting something.
In conclusion, do not let daydreaming or enticing advertisements lure you away from the real path of trading.
Entering the world of trading;
Generating income from trading is simple because it has the same rules as those we have in our daily lives.
Entering the world of existence was not our choice, but we must adhere to its rules. Entering the world of trading is our choice. What is quite clear is that adherence to its rules is more important than the world outside of our trades. It's hard but rewarding and growth-promoting.
As explained in the introduction, the world of trading also has the same rules and principles that we deal with in our daily lives; we just may not be aware of them, and you might be in search of the holy grail, just like I was in the first five years of my entry into the world of trading.
Important knowledge;
Listen, for I have heard the advice of the elders / Before you, they have existed and after you, they will exist (Sheikh Saadi Shirazi)
Behavioral finance, according to Eugene Fama's definition, is an approach to identifying the behavior of current traders in the market, which leads to understanding cash flows in trading markets and price movements.
The dynamic world is constantly changing, where every second is different from the previous one. It is a world full of stimuli, each stimulus triggering a process, and each process leading to a result, which in turn will be a stimulus for the emergence of new results.
It is shortsighted to think of all current processes as similar to a time when their previous stimuli existed without their current results. Current results and events exist, whether we want them or not. The decision of the people of a country to change their president, considering its domestic and foreign policies, whether they like it or not, affects the internal and external conditions of that country, its economic situation, wars, etc.
The market is a mirror of such changes, and ignoring its dynamism and updating will result in nothing but the removal of the trader from the world of trading.
The necessity of price behavior;
So far, we have learned that we need to look at prices realistically, but the main question is how to predict the behavior and next moves of traders with higher probability?
In the Chartical method, no indicators, oscillators, patterns, or even various technical analysis methods like harmonics, classics, or any other method like Elliott and even fundamentals are used. In this method, the trader seeks to know which type of traders are the effective participants in the market? Who are the main players, meaning the traders who are present in the market with large and influential amounts of money?
Or are they professional traders, meaning traders whose money does not have much influence on price movements but have analyzable behaviors?
Or are they retail traders, meaning those whose money does not affect the market and cannot create good price movements?
The answer to the following three questions plays a significant role in saving you from the pitfalls of misleading trades.
1. Who are in the market?
2. In which direction are they?
3. How long will they be there?
Entering and staying in any community requires observing the culture of that society. By considering the clues available in trading charts, you can recognize the dominant community in that market as buyers or sellers and, with their cooperation, achieve profitability
Identifying price behavior through charticals involves paying attention to one of the most important principles in social sciences. As mentioned, the focus in behavioral finance is on the community of traders. Therefore, it is necessary to understand the motivations, inclinations, and emotions of traders at any given moment, as well as the decisions they are likely to make.
Positive Tension:
Imagine a positive scenario in the shopping mall example where a lottery with valuable prizes is announced, attracting a majority of people to participate. In this case, the community's behavior can be predicted with a higher probability because the choices available to individuals during tension are limited. Thus, anticipating the behavior of the community during such periods of tension becomes more feasible.
Negative Tension:
Similarly, in negative scenarios such as a fire alarm or any other emergency, people move collectively towards exits. This collective behavior under stress also allows for relatively accurate predictions of the community's behavior.
Conclusion:
To predict price behavior, particularly of influential traders (market movers), one should anticipate moments of tension. If we liken ourselves, as smaller traders, to the various customers in the shopping mall scenario, our survival and profit-making depend on identifying and aligning with the larger players in the market. Just as a child needs to stick close to their guardians for survival, smaller traders need to identify and align with the larger market participants for success.
**Auction Theory**
Imagine a large auction is being held with one person acting as the auctioneer (the core of the market), who could be a bank, currency exchange, liquidity provider, or a fixed room. When the auctioneer announces a base price for a specific item (let's say $1000), individuals present at the auction know that the true value of that item is much higher than the announced base price. They are willing to become owners of the item to sell it later at a higher price and profit from this price difference.
The reason why individuals have this mindset is not important for us. In charticals, the most important thing for a trader is to be able to recognize what decisions, inclinations, and emotions effective traders in the market currently have.
The primary priority of the human physical and mental system is to fulfill the most stressful need. The more attention is paid to satisfying the activated need, the less pressure there will be on our physical and mental system to satisfy it, and, in parallel, less pressure will be exerted on satisfying the behaviors that meet it, and actions will be taken to meet other activated needs.
This process is also evident in price and people's inclination to trade at that price. The closer the price gets to a point where profit is minimized, the less inclination other traders will have to trade at that price or at worse prices, as they will face less satisfaction and less profit.
**Beginning of the Auction and Price Growth:**
The first participant in the auction, knowing that the desired asset is worth more, offers a higher price, say $1100, than the base price, intending to become the owner.
The second person also knows that the asset is still worth more and offers an even higher price, say $1300, than the previous bidder. This process continues successively, with each subsequent bidder offering a higher price ($1700, $2300, $3000, and so on), driving the price upward.
As long as participants in the auction know that the value of the item exceeds the offered price, their offers will continue to rise in order to become the owner of the asset, even if it means trading at worse prices.
**End of the Auction and Weakening of Price Growth:**
Eventually, the price reaches a point where individuals realize that although the asset's value was much higher initially, the offered prices are now so high that there is not much difference between the auction price and its actual value.
**Application of Auction Theory in Trading:**
In charticals, traders understand the clues about price changes.
The key to making a profit is to trade at a price that we predict with high probability, where other traders in the market are willing to trade at worse prices than us.
One of the keys to success is to have access to valuable information sooner than others. Being able to trade before others, when the trend has not yet taken shape in a way that every smart trader can recognize it, is crucial. Otherwise, what difference would we have from other traders? What share of the significant price movements that create signals for smart traders will we capture?
Understanding these concepts plays a significant and effective role in grasping the language of price. Understanding the language of price through charticals is easily achieved, enabling you to semi-consciously comprehend price movements, predict future price behavior, and have the best performance in managing your trades.
**Random Sequences:**
Sometimes novice traders observe movements similar to past behaviors in the price and expect the price to behave similarly to the past, but it doesn't happen; this phenomenon is indicative of a concept called random sequences.
According to random sequences, similar occurrences, like repetitions, happen, but they inherently have no identical reason or logic, especially in markets characterized by high dynamics.
Imagine there are a thousand people in a stadium. We give each of them a coin and ask them to continuously flip it for 5 hours. When the results are examined, do you think there are instances where, repeatedly, there have been 3 heads, 4 tails, and then again 3 heads? Why do you think this happens? Is there a meaningful pattern? Are environmental conditions causing it? Has the formula for measuring indicators led to it, or is it a natural sequence like Fibonacci?
The reality is that due to the large number of heads and tails flipped, several similar occurrences have happened randomly. In other words, none of those thousand individuals used specific coins, and the way they flipped the coins was not such that it led to any particular outcome; rather, due to the frequent occurrence, similar events have happened.
Another example: Sometimes we see clouds in the sky that resemble a particular object or creature in our minds. Clearly, we know that this event did not happen significantly. In charts, it's the same pattern. We must pay attention to whether the patterns are meaningful, influential, uniform, and similar or if they are random, and we have fallen into probabilities and randomness in the market.
In a market characterized by high dynamics, it is natural for random sequences to be common and frequent. Unaware traders who attribute meaning to these occurrences will fall into more trading mistakes.
Trading based on random sequences is a prominent example in the specialized and scientific trading environment of striving for Darwin's prize, and the profits gained from trading through random sequences will themselves be that prize.
**Darwin's prize** is a metaphorical prize for individuals who, through foolish actions, either lead to their own death or render themselves infertile, thus removing themselves from the path of human evolution. They will serve as a pattern and attraction for other individuals predisposed to acquire it. Thus, the superiority of human genes is enhanced during the process of evolution.
Now, what is your opinion and decision?
**Difference between Analyst and Trader:**
You might have encountered individuals on social media who are good at analysis but not successful in trading, or vice versa, individuals who are successful traders but cannot clearly articulate their trading methodology because they don't look at price movements as patterns.
This difference lies between being an analyst and being a trader. Put simply, an analyst, at best, tries to justify price behavior with various chart drawings and seeks to develop attractive and controversial scenarios for initiating or continuing market movements. However, a trader is always looking for trading opportunities aligned with price behavior, with a high probability of success, for entry, and then managing it optimally.
A professional trader utilizes their knowledge in the moment of trading and acts in accordance with the reality principle of the market, not justifying how the current trend formation and price movement occurred. Maturity should lead to action. A professional trader should bring their account and trades to a sufficient level of maturity, which only happens through action, not words.
Survival Factors in Trading:
1. Maximum Security Level (Stop Loss): "Preserving Security"
2. Suitable Entry Opportunity: "Reality Check"
3. Proper Volume Management: "Adaptation to Reality Principle"
4. Exit Strategy: "Emotion Control"
5. Journal Analysis: "Acceptance of Reality Principle"
6. Updating Trading Checklist: "Continuous Growth"
7. Adherence to Own Rules: "Self-Esteem"
I recommend reading the foreword of the book carefully and patiently before continuing with the rest of it.
**1 - Maximum Security Level (Stop Loss): "Preserving Security"**;
As mentioned in the preface of the book, preserving and enhancing security is intertwined with survival. Can we continue without survival? Can we maintain survival without security? Does security have a way other than adhering to simple rules we have learned to protect ourselves through them?
So, in order to continue presence in the market and to benefit from our high potentials and the market to achieve our goals, we must first maintain our survival and establish our security; we must protect ourselves against the dangers and threats of the market.
Protection against market risks and threats occurs when we are at risk (the possibility of losing financial and mental security), which exists from the time of entry into the transaction to the exit.
The importance of "Maximum Security Level" (Stop Loss) in transactions is so great that it has always been said that a trader who does not set the "Maximum Security Level" (Stop Loss) in his transactions behaves foolishly. A trader, in order to make a suitable transaction, should not act without protecting himself (financial and mental); because according to the principles of efficient markets, any transaction can be contrary to the trader's benefit and expectations. In other words, every transaction, with all its potential for profit, has a potential threat as well.
So we must use the "Maximum Security Level" (Stop Loss) to protect ourselves in the worst-case scenario of price behavior, which is beyond our readiness and control. Whether this maximum security level is financial or mental, both can threaten our survival in the market.
One should recognize that the world is much larger than what we can predict and control. There is always something beyond our readiness to happen, both good and bad. What matters is our management of these events. A trader must recognize this issue more than any other sentence and reality. The world is only limited to our minds.
**Definition of Maximum Security Level (Stop Loss):**
- The maximum level of financial and psychological tolerance that a trader is willing to accept for a trade.
In other words, up to this level of loss, the trader's psychological security is not threatened to the extent that it would lead to anger, grief, etc., affecting their subsequent trades. Furthermore, this financial loss will not be so significant that the individual loses profits from previous trades or even some of their capital, leading to inappropriate decisions in subsequent trades. Therefore, traders must consider the maximum security level (stop loss) for their trades to preserve their survival in the market by protecting themselves.
**Location of Maximum Security Level on the Chart:**
On the chart, the maximum security level (stop loss) is a point where it is likely that the price will move back in the expected direction and towards the trader's profit before reaching it. It can be said that the maximum security level on the chart is the point at which there is little hope that the price will move in favor of the trader again. If the price reaches this point, it is likely to continue its movement against the trader's expectations and interests. Therefore, technically, traders should identify a point on the chart as the maximum security level, which, scientifically, should be a point that, if the price has not reached it yet, there is still hope for the trader.
Technically, the maximum security level on the chart is considered a point before the first obstacle (in the opposite direction of expectations) because price obstacles are reversals where many trading orders are concentrated. When the price reaches these obstacles, trading orders are activated, and the flow of orders created leads to further continuation or reversal of the price. This rule applies to both buying and selling transactions.
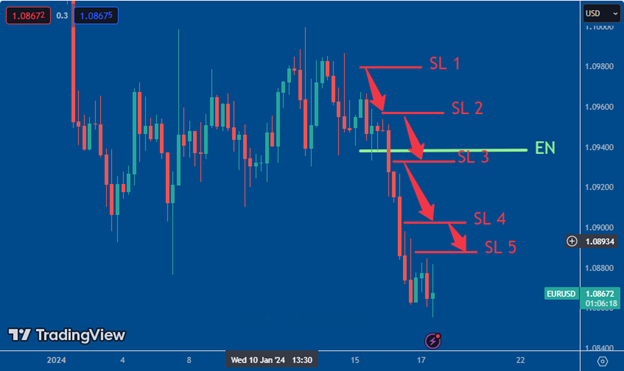
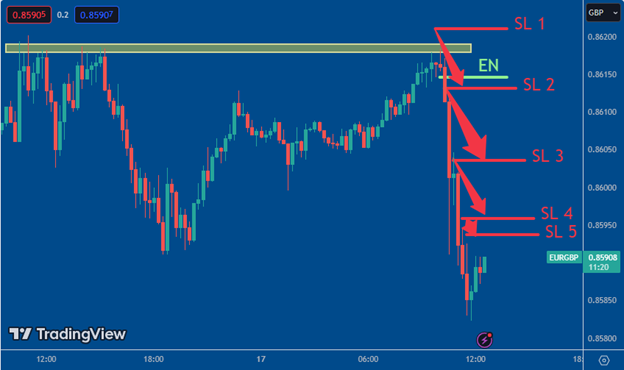
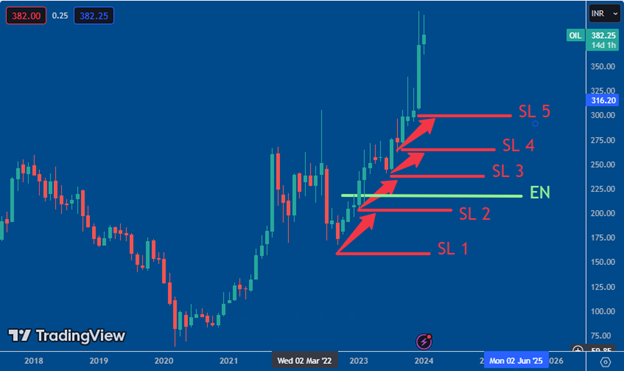
**Maximum Security Level (Stop Loss) Defined:**
The maximum security level represents the last opportunity for the price to return in the expected direction and benefit the trader.
Important Points:
- Before entering a trade, the maximum security level on the chart should be identified so that the cost of that trade can also be estimated.
- After entering a trade, we are only allowed to decrease the maximum security level to our advantage (the exit strategy will be explained).
**Adequate Entry Opportunity: "Reality Check"**
Naturally, as healthy individuals, we enter trades with the goal of making profits, not losses. The process of searching for an adequate entry opportunity to a trade begins with profitability in mind. Therefore, we must adhere firmly to the rules and efficient trading techniques. Because if our profit-oriented mindset dominates the market reality, we will not consider the actual behavior of prices and, influenced by our dreams, we will only be seeking entry opportunities with hopes of profit. Ultimately, after facing our inconsistent or inadequate reality, we engage in denial, rationalization, and reasoning.
The consequence of such an approach is found in compromising our trading rules. By ignoring the unsuitability of trading opportunities, we enter into them. This is where the importance of "reality checking" becomes apparent. The higher our reality checking, the more proportionate our trades will be to the reality of price behavior.
Imagine driving on a road and suddenly encountering a deer. Would it be logical to be upset about why the deer has come onto the road, causing you to slow down or stop? No. Because it is us humans who have built roads for crossing from one city to another in the habitat of these animals. In fact, the forest is the habitat of deer, and we have built roads for our own passage from one city to another in their habitat.
Looking at candlesticks with a perspective of candlestick patterns, indicators, oscillators, etc., is also in the same vein. The price moves among numbers on a chart traded by traders, not because of Fibonacci percentages or Bollinger Bands or Ichimoku.
**Thus, when the price can directly provide clues without any intermediary, we will be one step ahead of other traders.**
In efficient markets, price acts as a mirror reflecting all the events behind the scenes. Analyzing price behavior allows us to identify the impact of traders' thoughts, tendencies, and emotions present in the market. What could be a faster and more accurate tool than this to help us make the right decisions, suited to the real conditions of the market?
A successful trade is one in which the price is traded at a level that other traders in the market are willing to trade at levels worse than that.
Remember that in today's world, wealth creation is not only about having knowledge or having money but about having information that we possess sooner than others.
Information reaches our brain's processing system through our five senses. Reality is what we observe, hear, touch, taste, and smell. One of the most significant reasons for traders' failure and their entry into inappropriate trading positions is cognitive distortions and the many meanings they impose on any information received.
Our meanings, analyses, and interpretations of what we see are personal, and the reality of the market, in particular, will not be responsible for confirming or rejecting them. Acquiring information that helps us take action even one step ahead of others leads to wealth creation.
By information, we mean anything that helps us identify who is currently in the market: the main players, professional traders, or retail traders? Also, in which direction they are trading and how long they will remain in their trades?
**Analyzing the Suitable Number of Candles on the Chart:
A very important point to consider is how many candles a trader should have on their chart to identify sufficient and valid clues and have suitable and successful trades.
**Historical Memory in Trading:**
The concept of historical memory applies to the world of trading as well. Traders need to know how to utilize it to achieve the best results. To better understand this concept, I'll explain it with a few examples.
Imagine two people get married, and as you know, marriage is one of the most beautiful events in a person's life. In the first months and years of marriage, the couple tries to surprise and make each other happy on various occasions such as the anniversary of their first meeting, their wedding anniversary, birthdays, Valentine's Day, and other significant dates.
However, after a few years, they gradually and unintentionally begin to forget these dates. First, they might forget the anniversary of their first meeting, then their wedding anniversary, or the date of Valentine's Day. Over time, they might even forget each other's birthdays.
This doesn't mean the end of their love; it just means that new, pleasant events have occurred in their lives, making those previous dates less significant. For example, they may have had children, achieved significant progress in their careers or education, bought a house, a car, or a vacation home, and generally experienced advancements that are currently more exciting and engaging for them.
The same principle applies to the painful events in life. For instance, when someone loses a loved one, they might not sleep or eat properly during the first week. Gradually, after about 40 days, one can joke lightly with the grieving person to help lift their spirits. After a year, the grieving person typically returns to their previous state of mind and resumes their normal life.
This doesn't mean the deceased is no longer dear to them; in fact, they might feel the absence even more acutely. However, because this event has faded into their historical memory and new subjects have arisen, it becomes less prominent.
Price movements on a chart are also influenced by historical memory. Behind every trade, there is a human being, and all humans have historical memory. We, too, must consider this when making better and more profitable trading decisions.
In trading, historical memory affects how traders perceive and react to price movements based on past events. Just like the personal examples, past market events become less influential over time as new information and developments occur. Recognizing this helps traders understand why certain price levels might lose their significance and why market behavior evolves. This understanding can lead to better decision-making and timing in trades, as traders can anticipate how the market might respond based on the fading or persistence of past influences.
**The Importance of Historical Memory in Trading:**
Every event that has occurred in our lives up to now is significant because it exists in our memory, and we make decisions and take actions based on this historical memory. Thus, in trading, we need to understand how many candlesticks are necessary for analysis to make a good trade.
In the Chartical method, the sufficient number of candlesticks for analyzing and assessing a chart is approximately 70. However, as a trader's skills improve, this number can be reduced to around 30 candlesticks.
This concept emphasizes the importance of understanding historical price movements and how they influence future decisions. The idea is that by analyzing a sufficient number of candlesticks, traders can get a comprehensive view of past price behavior, which helps in making informed predictions about future movements.
To summarize:
- Historical Memory: Our decisions are influenced by past events stored in our memory.
- Candlestick Analysis:In trading, it's crucial to analyze enough candlesticks to understand the price behavior.
- Chartical Method: Initially, around 70 candlesticks are analyzed, but with experience, this can be reduced to about 30 candlesticks.
By incorporating historical memory into their trading strategy, traders can improve their ability to predict market movements and make more profitable trades.
**Determining Trades with a Limited Number of Candlesticks:**
With the right number of candlesticks, we can determine whether we should enter a trade in the market. If we decide to trade, we can also decide whether to be a buyer or a seller. Furthermore, we can plan our exit strategy for the trade.
If we focus on too many candlesticks, we risk basing our decisions on information that is no longer relevant to the influential traders who drive market movements. Such trades would not be logical.
In the Chartical method, we should focus on clues and techniques that are both sufficient and relevant to what the current influential traders in the market are considering. Otherwise, we risk basing our trades on outdated information.
### Market Text:
The candlesticks that are analyzed according to the principle of historical memory on the chart are referred to as the "market text." Essentially, the market text consists of a sufficient number of candlesticks used to identify clues for understanding the future price movement.
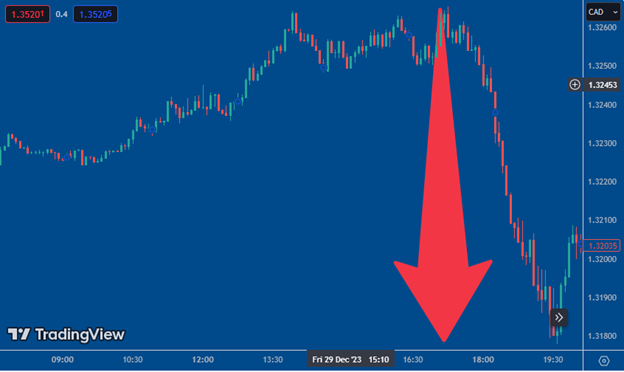
### Price Reversal - Tension Zone:
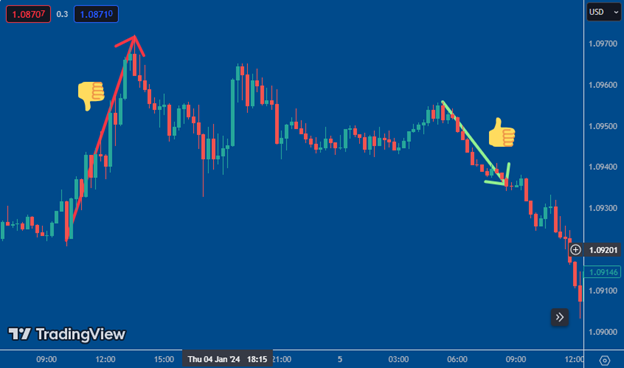
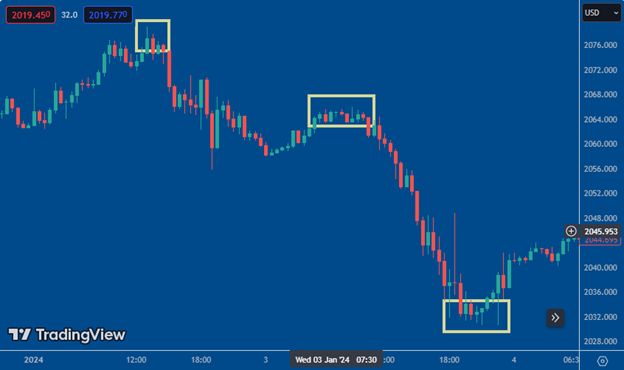
In the Chartical method, the terms "price reversal" and "tension zone" are equivalent. From now on, both terms will not be used together; they refer to the same concept. A reversal in charts refers to the point where the price changes direction, indicating a shift in the trend. Below are examples of effective reversals where the price direction changes. Before the reversal, the price movement was upward, and after the reversal, the price movement became downward.
### Key Concepts:
1. **Market Text:**
- Refers to the sufficient number of candlesticks necessary to identify clues for future price movements.
- Ensures traders focus on relevant and current market data.
2. Price Reversal/Tension Zone:
- Indicates a point on the chart where the price changes direction.
- Marks the transition from an uptrend to a downtrend or vice versa.
By understanding and applying these concepts, traders can enhance their analysis and make more informed trading decisions. The focus on the market text ensures that the analysis is based on the most relevant and current information, while recognizing price reversals helps in identifying critical points for potential trade entries or exits.
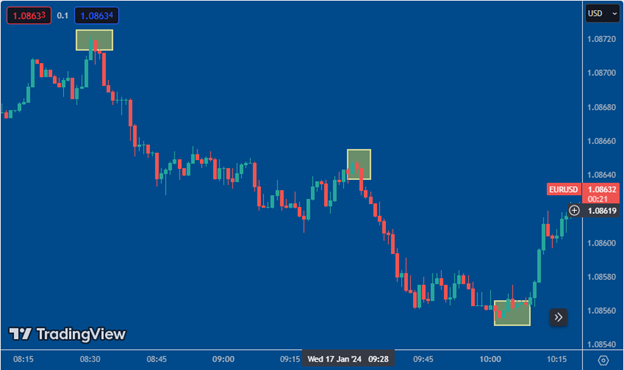
So, the part of the chart where the price turns around and goes back is called a reversal. To identify it, we will not use any tools such as technical methods, fractals, or any indicators. Instead, we simply look at the chart and consider any part where the price has turned around as the tension zone.
As you can see in the image above, if we consider all the tension levels on the chart, our chart will no longer look like a trading tool but rather like a sheet of guitar notes for playing. With a cluttered chart, we can't see everything we need to observe.
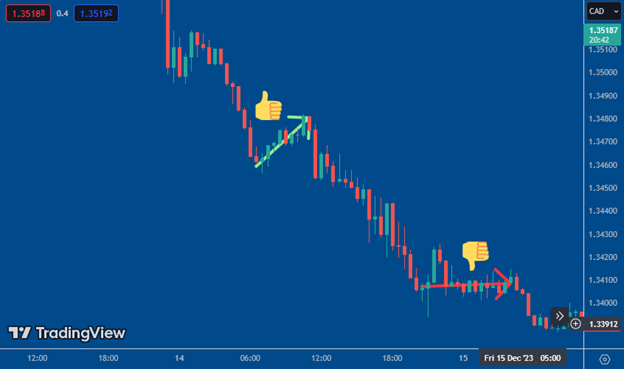
Effective Reversal:
An effective reversal is one where a sufficient flow of orders is created afterward, and the price moves adequately.
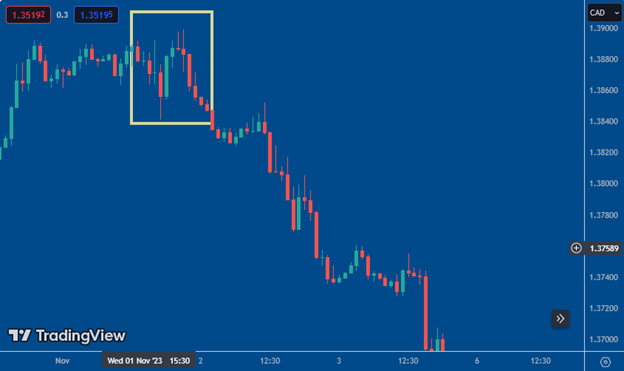
There are reversals on the chart that are ineffective. As you can see in the image below, the marked area is not an effective reversal because the price did not make a significant move after it.
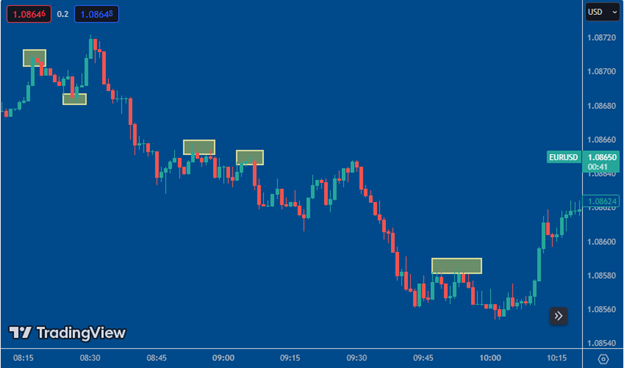
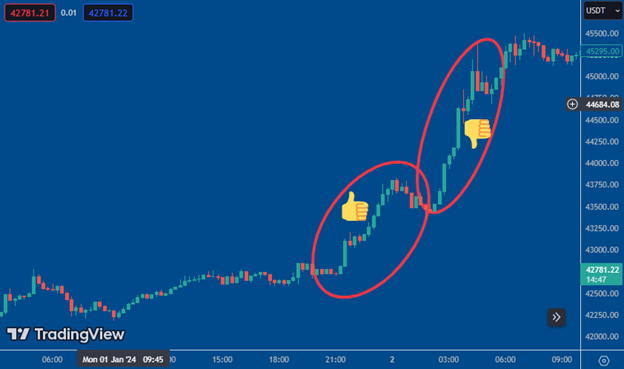
Earlier, we read that all trades occur at the core of the market, and regardless of indicators, analytical methods, or time frames, orders are queued and processed sequentially, with each price being addressed only after the volume at that price is exhausted. When a movement cannot continue, it means there hasn’t been enough buying volume at worse prices to sustain it, and there hasn’t been effective money behind that reversal.
In the image below, when the price moved upwards, it immediately stopped and returned to the vicinity of the reversal. Therefore, we only consider a reversal after which sufficient money has entered the market.v
There is a theory known as Troxler's fading, which comes from the psychological aspects of trading. It suggests that when we focus excessively on something and search too much about it, our alertness becomes overwhelmed by information and ultimately, we fail to see the significant matter that we should. Therefore, we only consider those reversals that are effective.
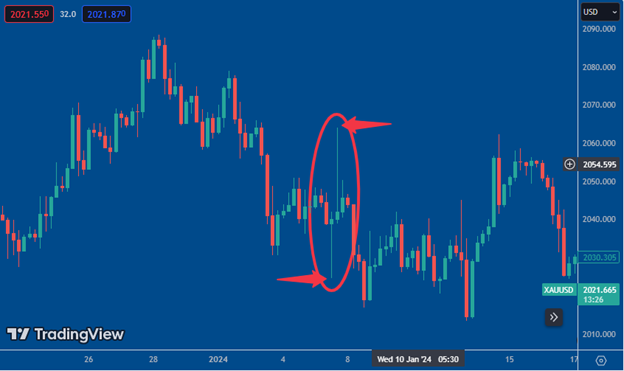
Sometimes, on charts, due to various reasons such as the release of statistics or news related to symbols or political, military, social events, etc., we observe shadows that are unconventional compared to other shadows in the market context.
A Persian proverb says; "When the town is without a sheriff, the frog becomes a gunslinger." This proverb also applies to charts. When major traders are absent in the market, small traders will have an impact on price movement.
If a drop of ink is dropped into a pool full of water, how much impact will it have compared to if the same drop of ink is poured into a glass of water? The same principle applies to charts; the ink drop represents the impact of small traders, and the glass and the pool represent the absence or presence of major traders respectively. Thus, when major traders are absent, the trades of small traders affect the price, and when their money runs out or their emotions subside and major traders re-enter the market, the price returns and leaves nothing but a shadow of itself behind.
Therefore, an unconventional shadow should not be considered. The shadow should be conventional and comparable to the average shadows found in the market text.
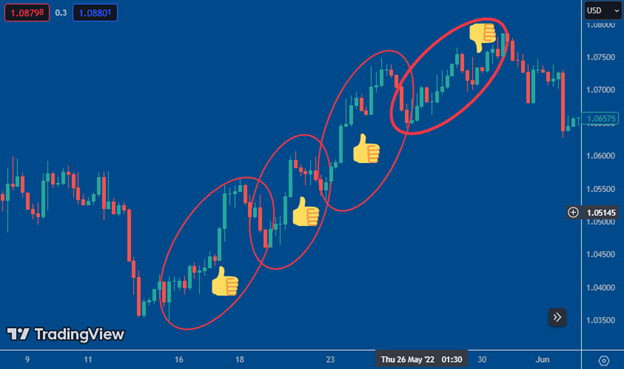
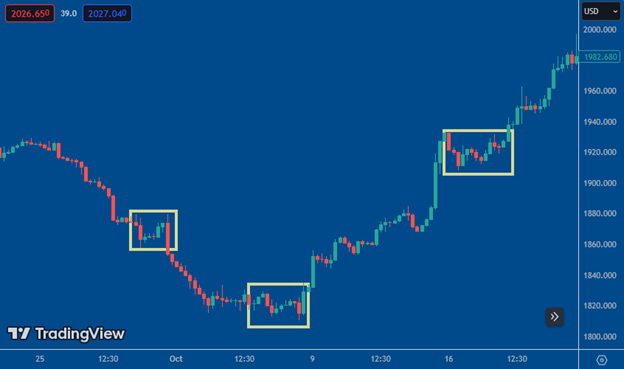
Key Area;
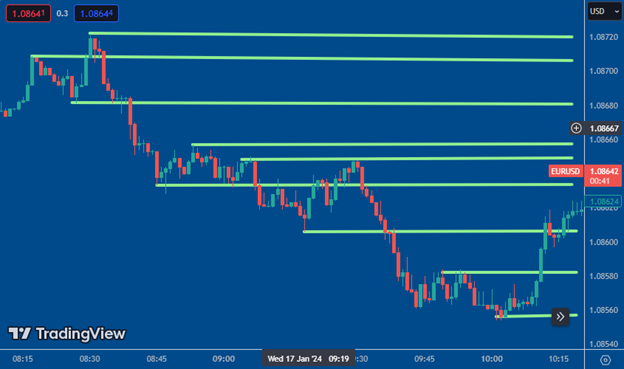
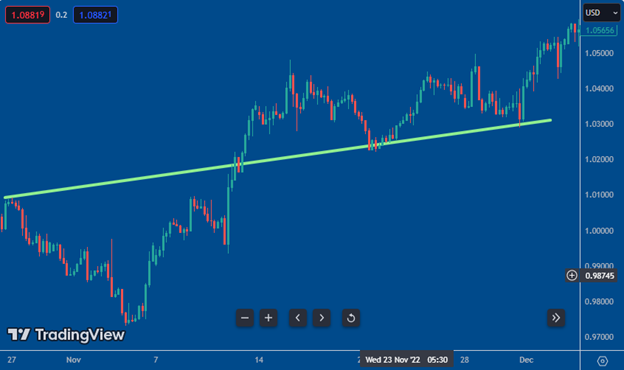
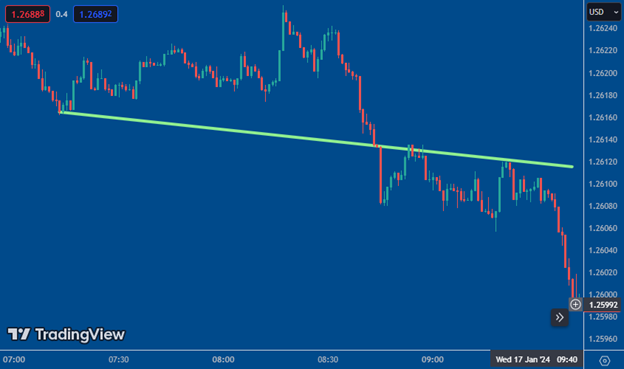
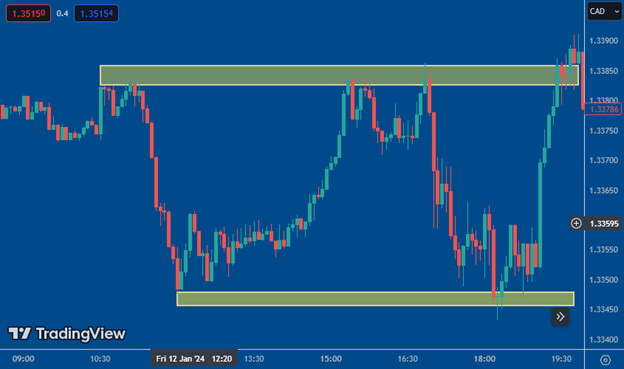
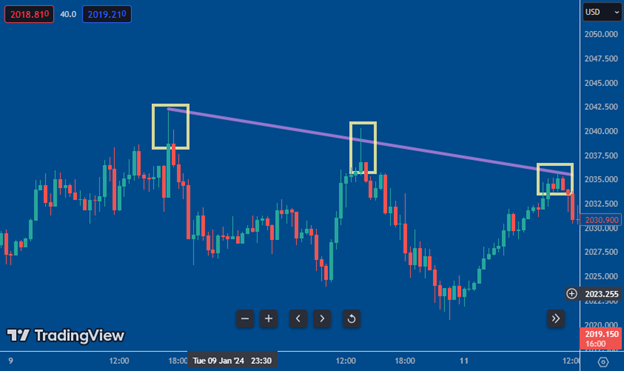
As you can see in the image below, there are areas aligned with a flat level, which are called static key areas.
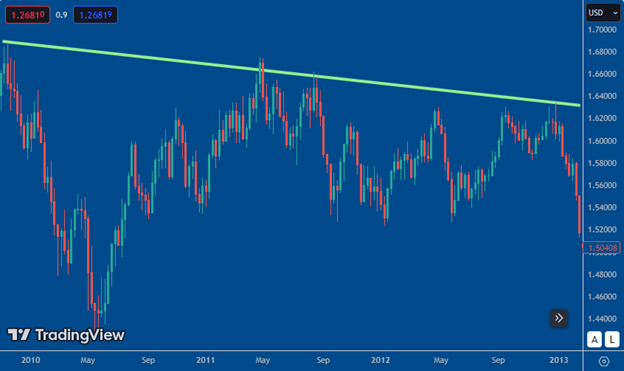
But if the areas are aligned diagonally, they are known as dynamic key areas.
In the Chartical method, the way to use these two types of areas is the same. The trading rules for static and dynamic situations are identical, and both have the same reason for formation.
The important point is that when considering these ranges, we are not looking for support, resistance, channels, or trend lines. Instead, we want to identify ranges where traders are likely to react. If support and resistance were present, prices could not move below or above a certain number.
According to Eugene Fama's definitions, terms like support, resistance, trend lines, and channels are rationalizations for price movements. Often, the price is rising and reacts to a level, but in another situation within the same market, it may reach a level and not react at all.
Some traders believe that supports, resistances, or channels influence prices, but in reality, price behavior is determined by the sentiments and emotions of the traders present in the market.
In trading, the crucial question is whether these ranges are genuinely significant or merely formed by a random sequence.
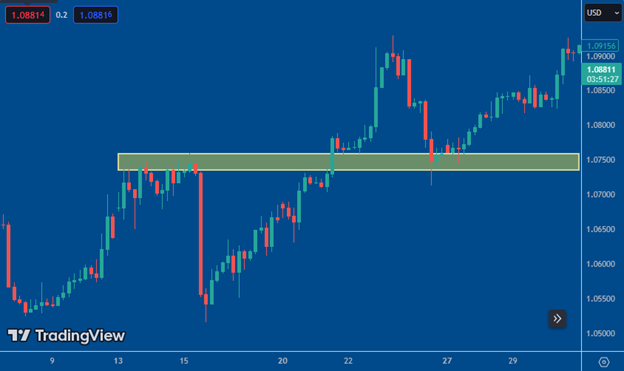
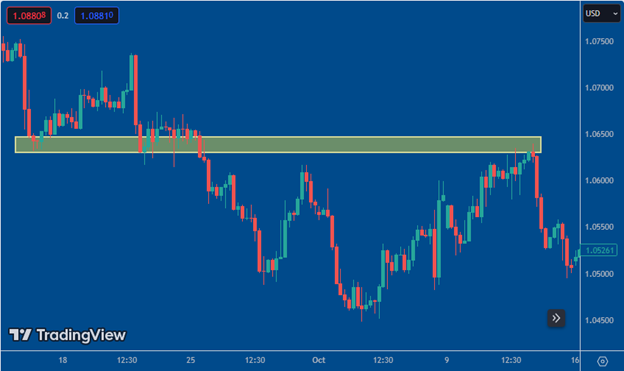
Golden Range:
The golden range is similar to static or dynamic ranges, but with a phase change. Whenever there is a range in the market context that, upon the price reaching it, leads to a descent, and then after the price rises again and crosses it, moves back towards the range but rises upon reaching it this time, that is the golden range.
The conditions for a sloped golden range are similar to those of a dynamic range, with the difference being that the ranges are aligned with each other.
We learned that ranges that are placed smoothly on the chart are called static key levels, and if the ranges are sloped, they are called dynamic key levels. Additionally, we learned that if the price passes a range, whether static or dynamic, and returns to that range, we expect a reversal movement and call it a golden level. The ideal condition for a golden level is symmetry and order.
Invalid Ranges:
In a chart, prices sometimes react to a range more than once. Because the number of price reactions to ranges is important to some individuals, it is necessary to provide a fundamental explanation in this regard.
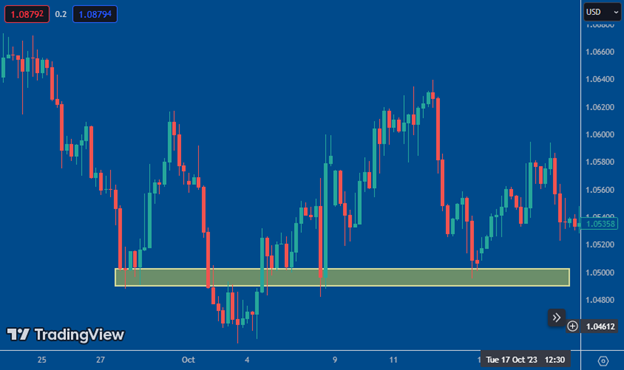
A trader should know whether a range that the price reacts to multiple times is valid or not.
It should be understood that the validity of ranges does not depend on the number of price reactions but rather on the density of trading orders within that range, which leads to a change in order flow.
Imagine a range on the chart that the price once broke downwards; this breach of the level, which should be clear, is called a level break.
When the price passes below the range, all stop-sell and limit-buy orders within that range are activated, and when the price moves from low to high, stop-buy and limit-sell orders are also activated. Once the trading orders are activated, they are no longer present. So, if the price crosses a range twice, and there are no trading orders left within that range to be activated and cause a change in order flow, that range is no longer valid.
Therefore, if the price reacts again within this range, it is not a meaningful behavior, as it is not influenced by the behavior of traders present in the market and is merely a random sequence.
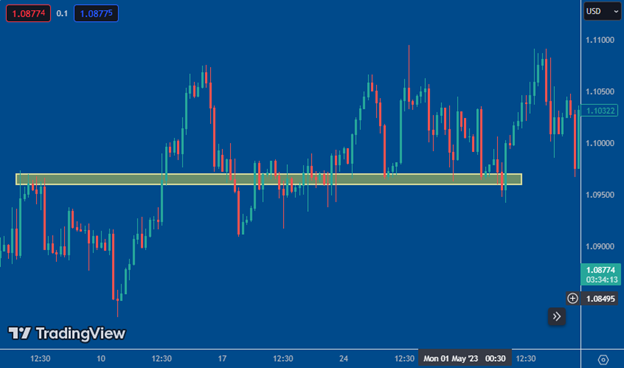
In simpler terms, when the price crosses a range twice, that range becomes invalid for us, and we should focus on newer ranges where trading orders have not yet been activated.
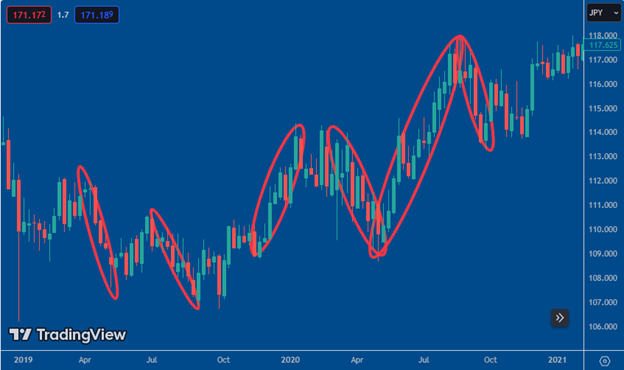
It's important to remember that prices in financial markets are so dynamic and constantly moving that various rotations or patterns are always forming on the chart. If one doesn't look at price behavior based on financial logic and scientific knowledge, they might misinterpret these movements as meaningful and with specific reasons. Consequently, they seek rules for them and trade accordingly, falling into the trap of random sequences.
Market Context Framework:
We learned how to identify price rotations. On the one hand, we learned why rotations are important to us and what practical uses they have, as well as which rotations are important for trading and to which ones we don't give importance.
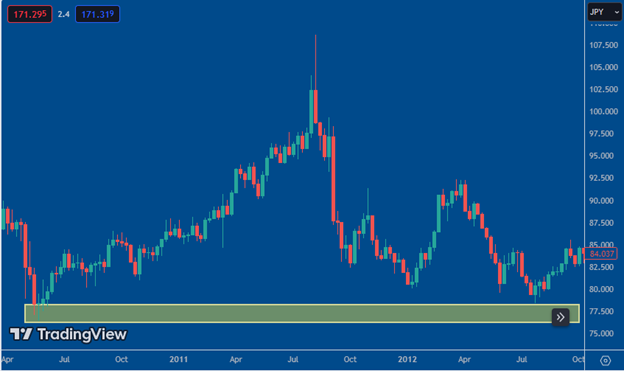
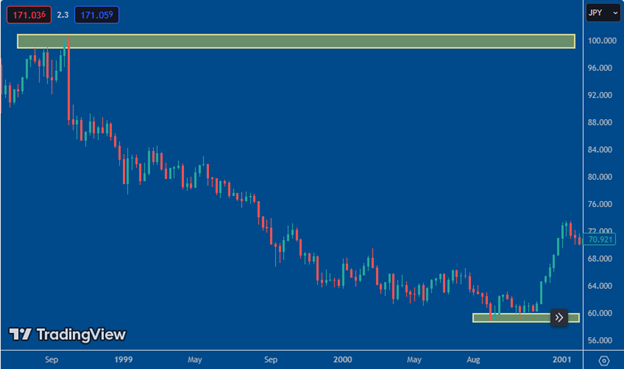
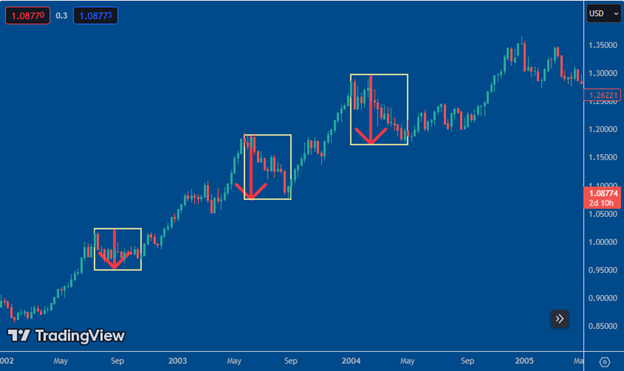
For example, in the chart, we have one rotation at the highest point and one rotation at the lowest point of the chart text. So, in this chart context, we have two effective rotations that are the highest and lowest. It's true that during price movements from low to high and high to low, there are other rotations as well, but these two rotations are adjacent to the upper and lower framework of the chart. We call these ranges the market context framework.
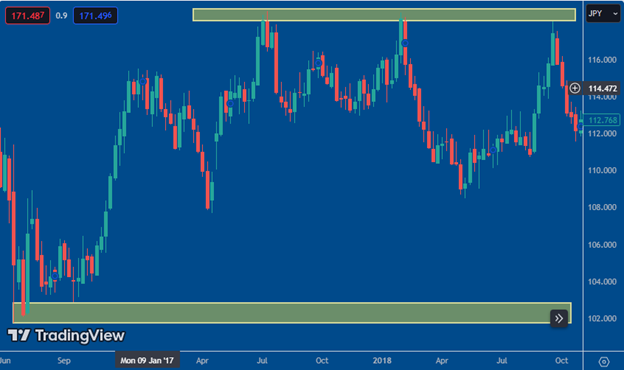
The use of the market context framework:
Although price behavior signals provide strong confirmation for buying, if the price is near the upper framework of the chart text, buying should not be done; because it's likely a trap. The same applies to selling trades. If the price is near the lower range of the chart, even if strong signals for selling are observed, selling should not be executed. This is called prudence.
When the price approaches these ranges, we should either wait for reversal trading signals or observe price behavior after passing through them and look for continuation trades, which I will teach in future chapters of this book.
When the price is near the lower framework of the market context text, we shouldn't look for selling opportunities; instead, we should look for opportunities that provide an entry edge for buying. Similarly, when the price approaches the upper framework of the market context text, even if price behavior signals for entering a buying trade appear, we shouldn't execute a buying trade.
This is because the tension range of the chart framework has enough potential to create fundamental changes in price direction. Therefore, even if every signal and clue points to buying, we shouldn't enter a buying trade; instead, contrary to trapped traders, we should execute a selling trade.
Traders are always striving to find suitable opportunities where large traders enter the market. Do you think the main players in the market prefer to enter trades after the price has traveled a long distance?
When the price moves from the bottom to the top of the chart, it forms one or more swings. Therefore, it is more likely to speculate what will happen at the upper edge of the framework.
are steps. All movements depicted in the chart are steps in price movement that differ from each other.
"We call those steps that are taller and move forward with more and more regular candles powerful steps."
"Also, we refer to the steps that form in the opposite direction of the powerful steps, with fewer and weaker candles, as corrections."
Note:
Weakness is a prominent characteristic of correction, and strength is a prominent characteristic of powerful steps.
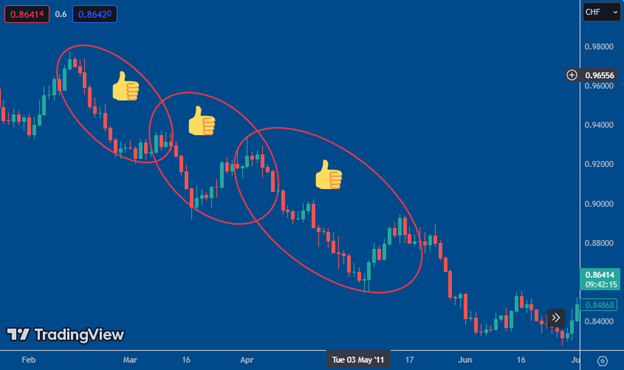
In the image, you can see an example of a powerful step and a correction. The taller and more powerful step is the "powerful step," and the shorter and weaker step is the "correction." Corrections also have less slope compared to powerful steps.
Uptrend:
In the world, nothing comes into existence suddenly; there are reasons and signs for every beginning. In technical analysis, to identify the start of an uptrend, we first need a "powerful upward step" followed by a "correction" in the opposite direction. The combination of these two side by side creates an "upward movement."
As long as the cycle of "upward movement" repeats, the uptrend continues. For now, understand that you're not supposed to buy with every upward movement or after it; I'll explain the exact details for trading in the future in this same book.
Downtrend:
To start a downtrend, there must be a "downward movement." The rules are exactly the same as for the uptrend, but in the downward direction.
Range and its principles:
When there is no upward or downward trend in the market, the market enters a "range" cycle.
There are two types of ranges: tradable range and non-tradable range.
Sideways range:
Sometimes, large traders are present in the market, but for reasons that are not important to us, they do not show interest in trading with significant targets. As a result, the price moves within a certain range in the market without forming a trend.
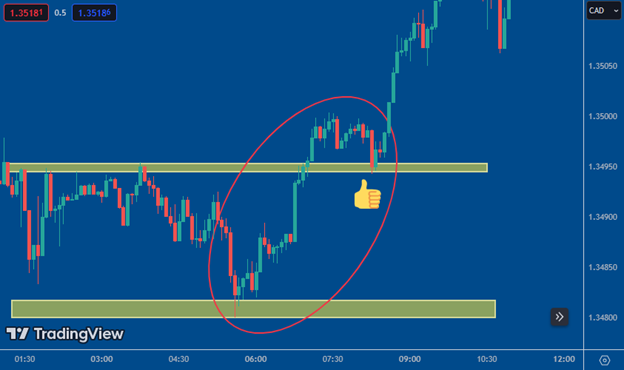
We call this price behavior a sideways range, and it is tradable. In this case, we buy at the bottom of the market text aiming for profit up to the market ceiling and sell at the top of the market text aiming for profit down to the market floor.
In the sideways range, based on the rules that I will discuss later in this book, we can determine the entry edge, the maximum safety level, and the proportional profit target based on price behavior and principles.
In sideways markets, prices move in different ways. In one scenario, the price moves from the upper boundary of the market text to the lower or from the lower boundary to the upper, involving several steps or movements. Another scenario is when the price in the market text only rises with two powerful upward steps and then comes down with a correction. This means that the price between these two upper and lower levels can move in any direction.
However, what matters to traders is having a sufficient distance between the two boundaries of the market text to trade within this range, to properly set the maximum safety level (stop-loss), and ultimately to make a trade with low cost but with a specific profit.
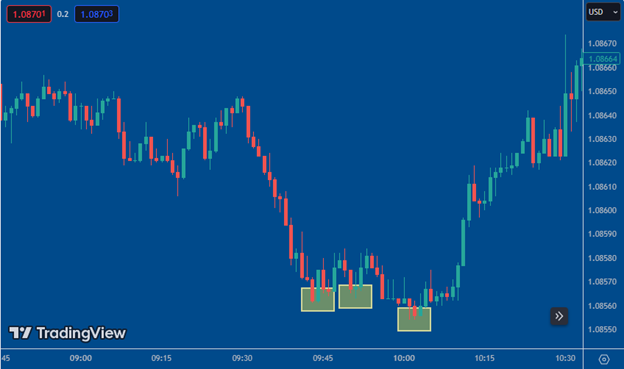
Choppy range:
Choppy range is another state of range where trading cannot and should not take place. Unlike the sideways range, large traders are not present in this market. As a result, the market will have erratic movements, and candles will constantly overlap each other. Contrary to the sideways movement, which moves very clearly from bottom to top or from top to bottom, in choppy range, the price movements are irregular and turbulent. In other words, an edge for entry into a trade and setting the maximum safety level (stop-loss) cannot be identified proportionally and clearly.
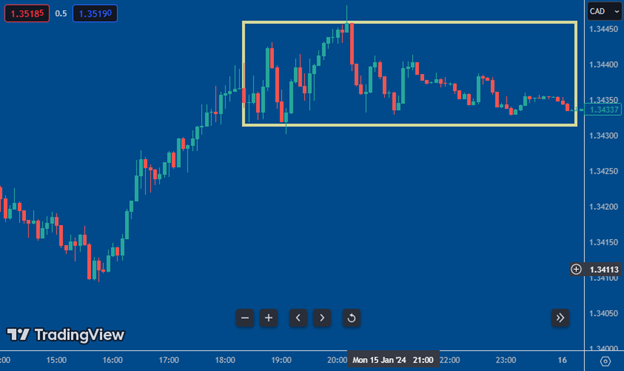
As you can see in the above image, there is no opportunity for entry and trade management. The movements are so chaotic that it's impossible to find a clear edge for entry and exit from the trade, and often the maximum safety level (stop-loss) is not clearly defined in these areas. The main reason for this is the absence of traders with large amounts of money and insufficient liquidity, as well as lack of direction.
Due to irregular and directionless movements, this range is labeled as "choppy." It's like the turmoil and turbulence created under a helicopter or behind a farm combine.
A trader should not trade in a market that is turbulent because, without the presence of market makers (the main players in the market), entering a trade will not be logical.
Unless you are invited by the homeowner, do you become a guest in their house?
If you encounter a choppy market, you should be able to easily pass through it.
End of the Sideways and Choppy Ranges:
The end of both the sideways and choppy ranges occurs when stronger market movements are created. Like other cycles, the range is not permanent and the market will once again have a trend.
A very important point that a trader should always remember is to look for the footprints of large money in the market. Everything that has been said up to this point and what you will learn in the future is aimed at finding these footprints.
The sideways range ends with the formation of the first movement (a combination of a powerful step and a correction), and the choppy range, in the best case scenario, becomes tradable by observing changes in the slope of the steps.
Correction Rules:
One of the crucial clues for traders are corrections, which provide very useful information for entering or maintaining a trade.
The powerful step and the correction in the chart are like the inhale and exhale of a human. Just as a human needs both inhaling and exhaling to sustain life, neither of them alone can keep a person alive. Similarly, in the chart, the powerful step and the correction play the role of inhaling and exhaling for the continuation of the trend.
When the market experiences an uninterrupted upward or downward movement, the trader should understand that this timeframe is not related to the order flow, and they should switch to a higher timeframe. If the higher timeframe is also the same, the trader should know that the price is moving in an emotional and unreliable manner.
When the price undergoes a correction, it provides an opportunity to enter a trade (whether continuation or reversal) after the end of the correction.
in the market for us. Using this information, we can enter trades at the best edges (lowest cost and highest probability of success).
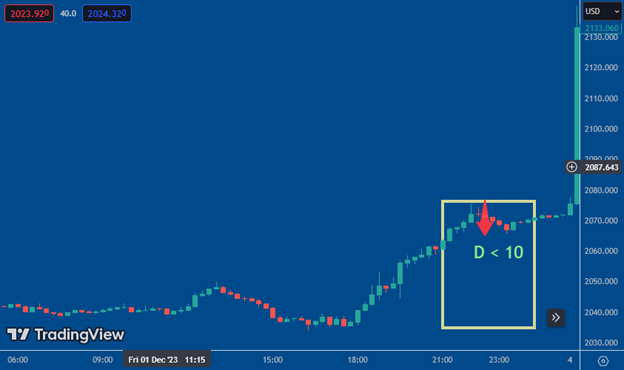
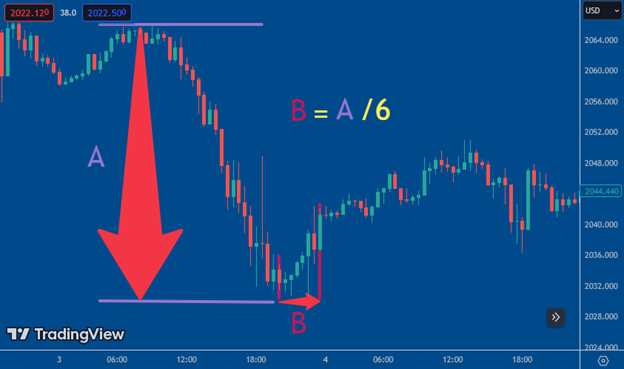
The depth of the correction is very important for traders. In normal conditions (sufficient presence of large traders based on the market's definition of effectiveness), the price behavior during a correction typically ranges between 15% to 50% of the height of the powerful move.
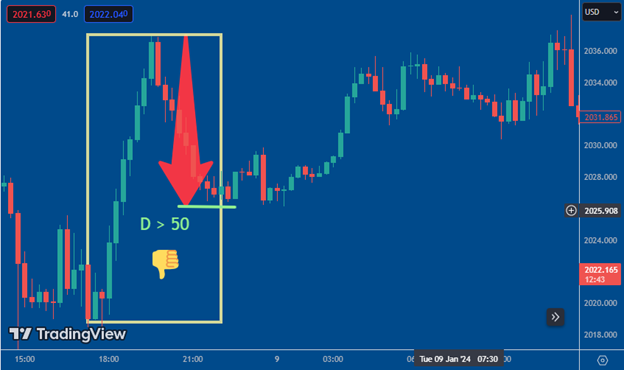
A correction depth exceeding 50% indicates a weakening of the constructive traders of the powerful move. Since trading along the trend implies trading in sync with the main market players, it can be inferred that trading should not be conducted in their absence.
Let's illustrate this with an example. Suppose a powerful move with a volume of 1 billion units of trading occurs, followed by a correction. As long as the depth of the correction is less than 50% of the height of this powerful move, it means that the constructive traders of the powerful move still dominate over the trapped traders. However, if the depth of the correction exceeds 50%, it indicates that the weight of the order flow is shifting more towards the trapped traders, increasing the risk (probability of failure) of trading in the direction of the powerful move.
Now, if the depth of the correction ranges between 25% to 10% of the height of the powerful move, it means that the accumulation of order flow from trapped traders is significantly less compared to the accumulation of order flow from the constructive traders of the powerful move. This indicates a high financial and psychological cohesion among the constructive traders of the powerful move, based on auction rules. Therefore, trading in the direction of the powerful move represents a trade with a high probability of success (low risk).
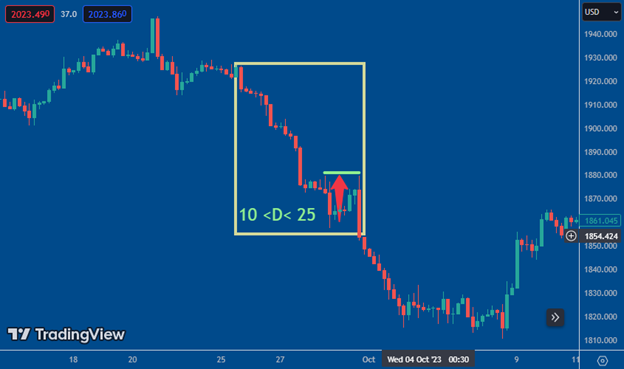
"Depth less than 10% corrections aren't corrections and are merely price breaths on lower time frames."
"Maturity of Correction:
As mentioned, price movement (strong move and correction) exhibits a rhythm, otherwise the price behavior is erratic, and according to trading principles, one should not enter a trade at that time. Another rule regarding the nature of a healthy price movement is the issue of maturity in correction.
Now that you know the correction is the result of accumulation of traders' order flow trapped in it, the rule of maturity is important for ending the financial and psychological congestion of traders trapped in correction. Recognizing the end of the correction, before most traders realize its end, leads to trading at much better price levels and experiencing high success probabilities with lower costs.
The characteristics of the maturity of correction are such that based on the current nature of price behavior, the length of maturity along the 'horizontal axis of the chart' should be one-third (1/3) of the height of the strong move 'parallel to the vertical axis of the chart'."
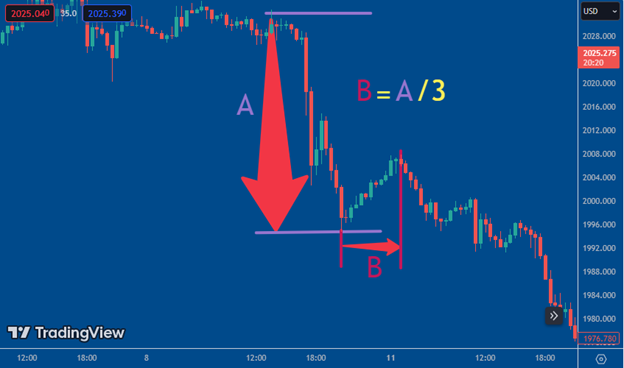
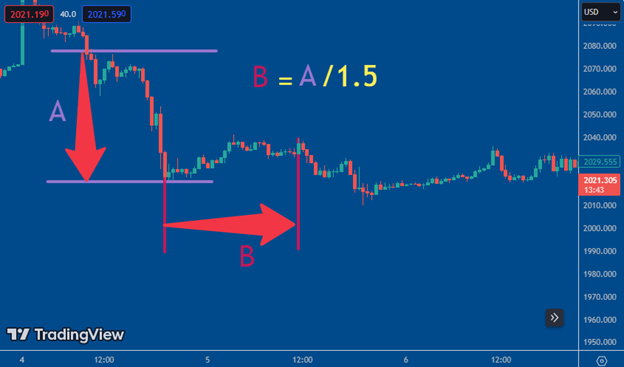
"Less than this amount indicates insufficient accumulation of order flow against the correction direction to end it, and more than this amount indicates choppiness in price behavior; in both cases, the trading risk will be high.""Detecting Changes in Trend Strength;
In this section, we will focus on identifying changes in trend strength based on intensity and depth.
Price Intensity;
A trader identifies the strong intensity of the next powerful move by examining clues provided by the powerful steps. The importance of identifying the intensity of the next step lies in helping us decide whether to enter a new trade after the end of the correction or to maintain the previous trade.
Definition of Price Intensity: Intensity refers to the net amount of price thrust in each powerful step. As you can see in the image, the intensity of price is equal to the length of the powerful step minus the depth of the correction.
When the intensity of price in the current powerful step is greater than the intensity of price in its previous powerful step, it indicates that according to the auction rule, large traders have more financial resilience than the recent powerful step, meaning they are using more liquidity for their trades; Therefore, a trade that we intend to make after the end of the correction will be low risk."
"Note that the term 'financial resilience' is used in this article, and we will also come to 'psychological resilience' later.
Note: We only compare the intensity of the current powerful step with the intensity of the recent powerful step.
If the intensity of the current powerful step has not changed compared to the intensity of the recent powerful step, it means that there has been no change in the financial resilience of large traders, and we can still enter a new trade after the end of the correction or maintain the previous trade.
However, if the intensity of the current powerful step has decreased compared to the intensity of the previous powerful step, it means that the financial resilience of large traders has decreased in the recent step. Therefore, we should not enter a new trade in the direction of the powerful step, or we should look for the best opportunity to exit our open trades.
Depth of the "Correction";
The trend does not necessarily weaken just because the trend-setting traders, who are no longer willing to continue it, are no longer willing to trade at worse numbers 'along the trend'. Instead, it may be affected by the preferences and resilience of the opposing trend traders (trapped traders) to some extent without significant changes in the financial resilience of the trend-setting traders. This means that in the community of traders against the trend, stronger expectations, preferences, or resilience may form compared to trend-setting traders, and from now on, their order flow will determine the fate of the price.
The depth of the correction refers to the extent of price retracement after the end of the powerful step in the opposite direction."
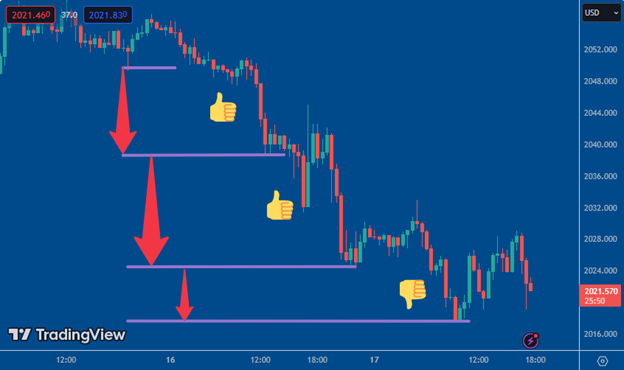
"The ranges indicated in the above chart represent the amount of price retracement in the correction relative to the powerful step. To identify changes in depth, we need to compare the latest depth only with the depth before it.
As long as the latest depth has not changed compared to the depth before it, it means that no change in the strength (order flow) of traders trapped in the opposite trend has occurred, and therefore, we can still trade in the direction of the trend after the end of the correction. Additionally, if this value decreases, we can still trade in the direction of the trend after the correction. However, if this value increases, we can no longer trade in the direction of the trend because it indicates that, in any way, the strength of traders against the trend relative to trend-setting traders has increased, and trading in the direction of the trend carries more risk.
Keep in mind that random movements often occur in the market, and if you don't have a calculated strategy to distinguish random movements from meaningful ones, the risk (probability of success) of your trades will increase significantly, and the percentage of times you'll fall into traps will increase, preventing you from consistently profiting in the market. All the clues you learn in the charticals will guide you to avoid falling into random movements and have more successful trades.
The same applies to downward movements. A trader in downward movements should also compare the recent depth with the previous depth. As long as this value remains unchanged or decreases, the trader can trade in the direction of the downward trend. However, if the depth increases, the trader should refrain from trading in the downward trend.
As long as the depth remains unchanged or decreases, you can stay in your open trades, but if this value increases, you should be on the lookout for the best exit from the trade.
Weightlessness:
When I tell you all the pieces of the charticals and we get to the stage of entering trades, you will learn how steps form. Now, to practice what you've learned so far, I need to explain the concept of weightlessness to you.
Whenever there is a significant shift in the weight of buy orders to sell and vice versa within a step, candles (1 to 3 candles) form in which traders apparently extending the step do not trade at worse numbers, and these candles overlap each other in a narrow range. These candles indicate the end of the current step, and we call them weightless candles, and that range, the weightless range."
Imagine a military commander who only focuses on the capabilities of his own forces and neglects changes in the capabilities of his enemies. It's possible that, without changes in its own capabilities or even with strengthening its forces, the readiness and capabilities of its enemies may significantly increase. Naturally, this neglect increases the vulnerability of his army to defeat. Similarly, a trader must always pay attention to changes in the behavior of trend-setting traders as well as the opposing traders.
In the future sections of this book, when we delve into the principles of entering trades and managing open trades, you'll see how important the concept of weightlessness is. But for now, you should use it to identify the end of each step in acceleration and depth exercises.
Step Slopes:
What you've learned in terms of the financial cohesion of traders was effective in the market. If you recall, I always use financial cohesion and mental cohesion together, considering both equally important and complementary. However, this doesn't mean that the clues to identifying these two will always occur simultaneously.
Remember that mental cohesion always precedes financial cohesion. Remember the nature of auctioning; if individuals are not inclined to possess an asset, no excitement will be observed in their behavior towards owning it, even with financial capability. Conversely, even if mental cohesion exists but financial capability doesn't, ownership of the asset cannot be achieved. So, although having both types of cohesion is necessary for trading, having one without the other is futile. What's more important is mental cohesion because even if financial capability exists, if there's no mental inclination or excitement towards owning an asset, that financial capability will have no effect on the fate of the price because it won't enter the market.
Signs of the end of the choppy range through slope:
It was previously mentioned that the sign of the end of the range is the formation of a movement (powerful step and weak correction). However, now that your awareness has increased, it can be said that a sign indicating the end of choppy range before a movement is the changes in slope in the choppy range. Keep in mind that this clue isn't always visible, but when it is, it's a reliable indication of entering a new trend direction due to the formation of the order flow weight.
Given that trading in these conditions has very low costs and very high profits, be careful not to only see what you want in the chart (confirmation bias). Always assess reality and avoid daydreaming and bias. Any bias in trading results in certain losses.
When the recent upward step slope increases compared to its previous upward step slope, it indicates an increase in the inclination and excitement of buying traders, provided that the slope of the downward steps remains unchanged or decreases.
When the recent downward step slope increases compared to its previous downward step slope, it indicates an increase in the inclination and excitement of selling traders, provided that the slope of the upward steps remains unchanged or decreases.
If the slope of both types of steps decreases together, it indicates a decrease in liquidity, and if the slope of both increases together, it indicates high excitement among small traders in the absence of large traders.
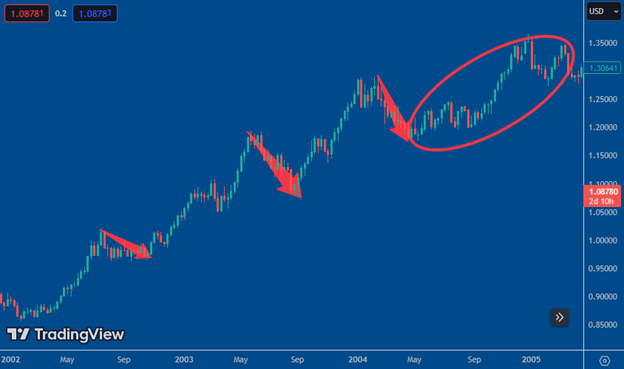
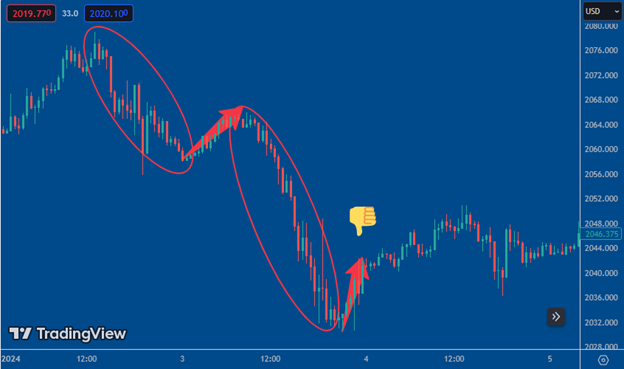
Conclusion of the section:
Sometimes, what a trader expects from the current trend before entering a trade doesn't happen after they enter. A trader must pay attention to:
1. Which category of traders are currently present in the market?
2. In which direction are they?
3. How long will they remain?
Traders' Party:
When invited to a party, there's a specific time for the beginning and end of the event, and one must be present within that timeframe. If we arrive during the final minutes or after the party ends, we can't enjoy its pleasures, and we might even have to help with cleaning up; meaning, we've incurred a cost without enjoying the benefits: a loss.
Entering a trade has similar conditions. If we don't pay attention to the three questions above, we won't have successful trades. Even if a trade results in profit, it's a "Darwin Award."
Counter-trend Correction:
Another type of correction is the "counter-trend correction." The type of correction mentioned earlier was for the continuation of the trend direction.
However, when the price reaches the upper or lower boundaries of the market framework and there's a high probability of a change in direction based on the clues of changes in the strength of the trend, we'll be looking for an opportunity to enter a trade against the previous direction. In such situations, the ideal opportunity to trade is when a counter-trend correction is created.
The concept and position of correction indicate traders caught in the trap, traders against the powerful step, which confirms the strength of the trend-setting traders.
At the end of trends, the main players in the market intend to enter trades against the previous direction and strive to execute their new trades. But novice or unaware traders who haven't noticed the new inclination and decision of the main players continue to trade in the direction of the previous trend.
Note that in this situation, we have two categories of trapped traders:
1. Those who are in the opposite direction of the previous movement.
2. Those who haven't noticed the new inclination and decision of large traders.
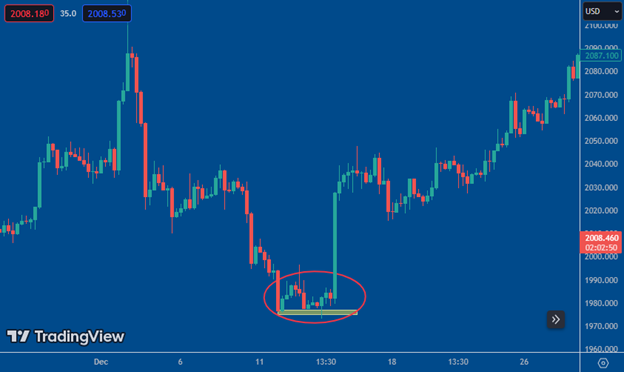
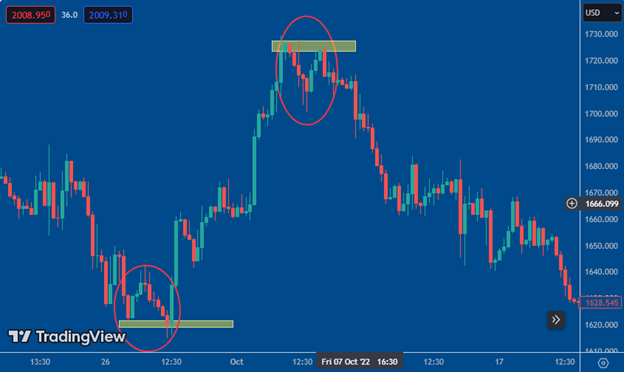
When the financial cohesion of traders in the second category trapped ends, it means the inability to continue the previous strong trend direction has occurred. A powerful clue of the lack of sufficient order flow to continue the previous trend is given; this means that the main players have exited from the previous direction. I will address examining the entry clues of large traders in the new direction after the "counter-trend correction" for entering trades in sync with them in the upcoming sections.
Types of Counter-trend Corrections:
- Strong (Old Market Stall)
- Weak
Strong Counter-trend Correction (Old Market Stall):
It occurs when prices relatively strongly depart from the previous trend and a new rotation begins. This strong correction is usually known as the old market stall. In other words, when this correction occurs, prices reach a new range on the graph, indicating the start of a new trend.
For a downtrend, a strong counter-trend correction usually occurs at the upper end of the market text. In other words, prices reach better and lower levels compared to previous rotations, indicating the creation of a new direction in the market.
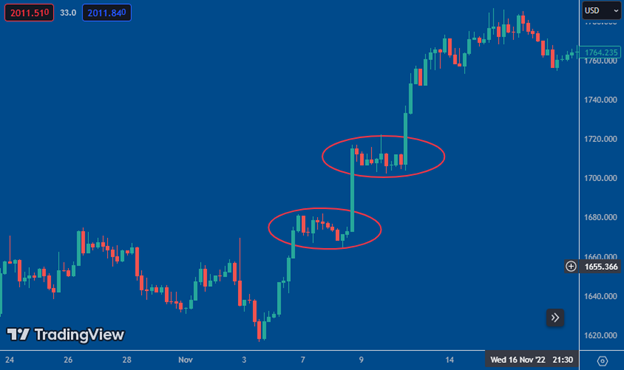
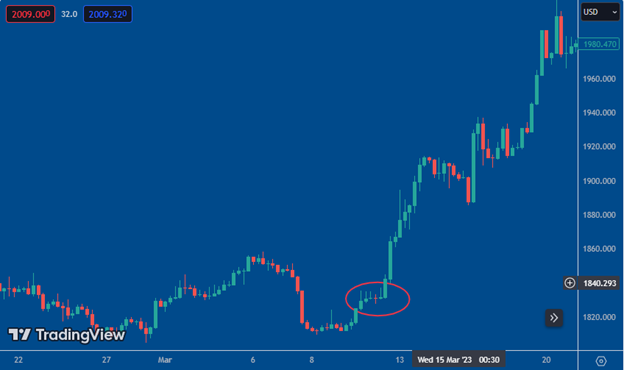
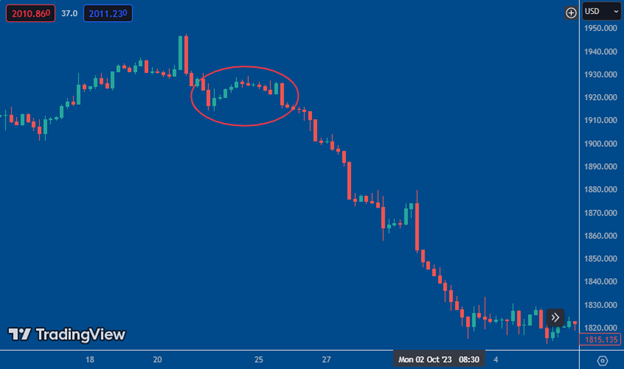
For an uptrend, a strong counter-trend correction occurs within the lower range of the market text, and prices should rotate higher (better prices) than the recent rotation.
Weak Counter-trend Correction: When the price rotation occurs at worse or the same prices compared to the recent rotation, it is considered weak. For a downtrend, a weak counter-trend correction occurs at the upper end of the market text, and the price rotation should be higher or the same (worse prices) compared to the recent rotation.

For an uptrend, a strong counter-trend correction occurs within the lower range of the market text, and prices should rotate lower or remain the same (worse prices) compared to the recent rotation
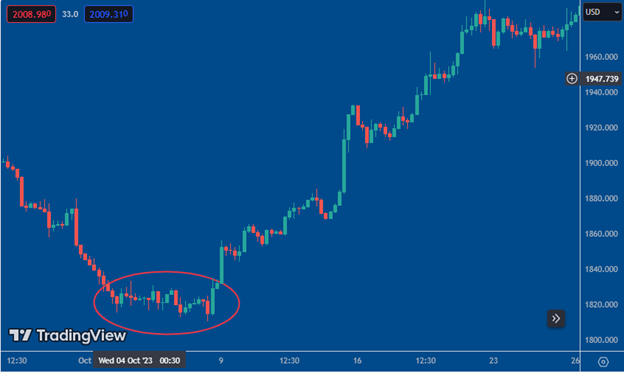
Entry Rules:
Summary so far:
- What is market text, and why should only this amount of past price behavior be examined?
- How do trends start and continue, and what rules do they have?
- Identifying how the strength of trends changes.
- Explaining the types of corrections and what each one indicates.
Now it's time to know the entry rules for trading opportunities appropriate to price behavior based on "reality testing" the key clues you've learned so far.
Candlestick Confirmation of Order Flow Change:
The application of the principles and skills learned so far is to identify suitable trading opportunities according to price behavior to achieve the lowest risk (probability of failure) in trades. Chartical is not a strategy or trading method; therefore, the trader does not need to change their strategy and trading method by learning the principles of Chartical. Chartical is the art and skill of trading. Through learning and using Chartical, the trader focuses solely on completing their trading skills and continues and advances their activities in financial markets with their chosen strategy and trading method.
Now I want to say that after identifying the entry opportunity, there are certain rules for entering a trade. Note that "entry opportunity" means that an opportunity has arisen to invest in the current conditions; investment has rules.
You have learned that weightlessness, the end candle clue, is one of the weak correction clues, meaning that the order flow has ended in the previous direction, and if the order flow forms in the opposite direction, you can enter a trade in the direction of the new trend by relying on the clue of stabilizing the change in order flow.
The Candle Clue for Stabilizing the Change in Order Flow:
Considering that price movement is linear, clues are based on this basis.
The sign of stabilizing the change in order flow is that after weightlessness, a candle in the new price direction closes in the one-third ending range. For buying trades, the candle must close in the upper one-third, and for selling, the candle must close in the lower one-third. The shape and color of the candle are not important; because based on the linear movement of prices, dominance of order flow in the time range is important.
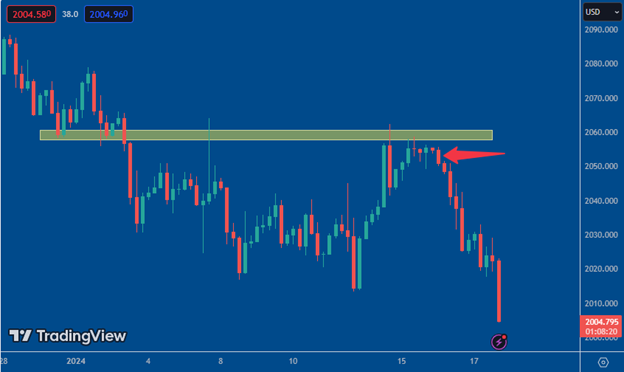
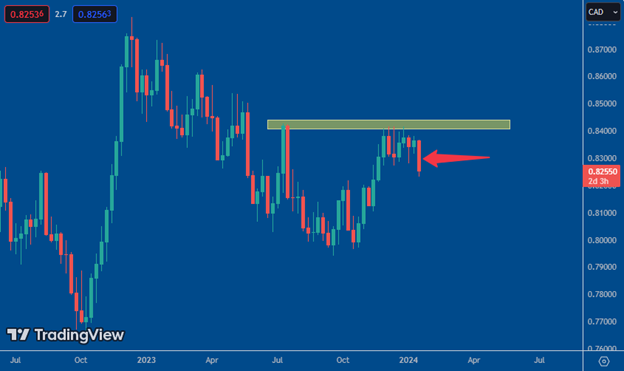
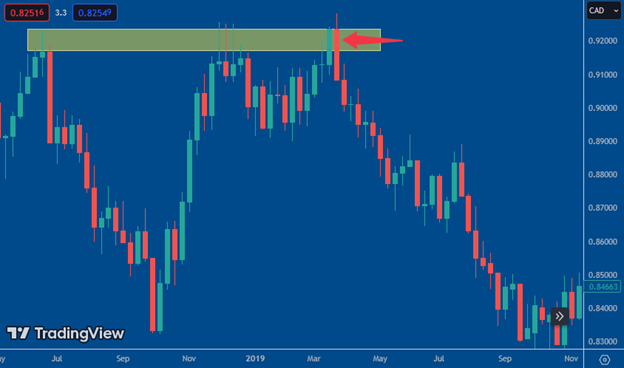
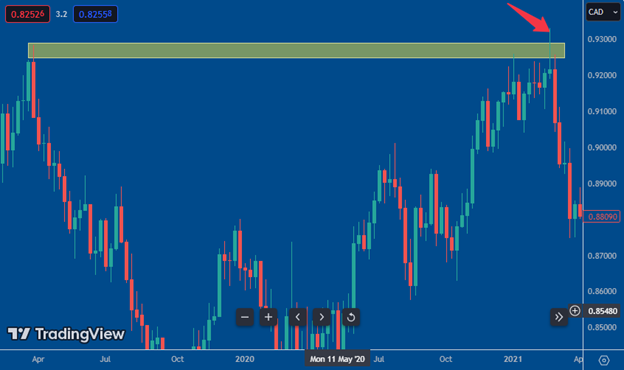
The ideal condition for the candle confirming the change in order flow is that, in addition to the above rule, a long shadow is created in the direction of the previous trend; because such behavior indicates a kind of inability to continue and the dominance of the new order flow with greater power.
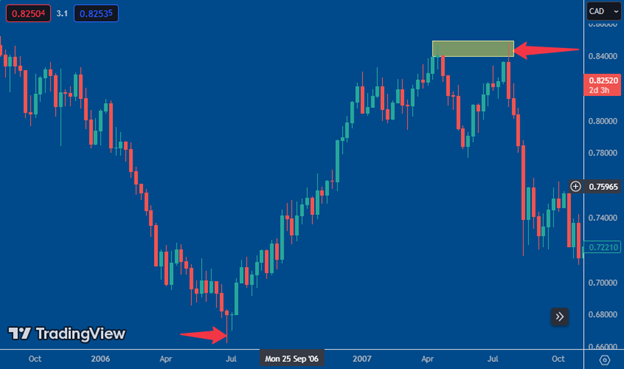

Entry Edge:
For entering a trade, it's essential to enter at a point where there's a higher probability of being in sync with other influential traders in the market. That's why the entry edge is typically at a slight distance from the worst price traded within the candle confirming the change in order flow.
Initial Risk Management Opportunity:
In any investment, although all aspects of capabilities and drawbacks are evaluated before entry, entry is made only if the likelihood of success is high. However, this doesn't mean that the possibility of unforeseeable events occurring and going out of control doesn't exist. That's why crisis control ability is crucial in trading.
Crisis control is essential in trading because, although all clues are evaluated based on price behavior before entry, and trading is done in line with price behavior, in efficient markets, the possibility of any unforeseen event occurring is there. This includes both the possibility of a strong and rapid movement in the profit direction and the possibility of a strong and rapid movement in the loss direction. Therefore, when entering a trade, it's essential to ensure sufficient opportunity for crisis control.
Hence, from the entry edge to the first effective turnaround, there should be approximately 3 candles (for each time frame) at the average recent candle range to have enough opportunity to reduce volume, move the stop-loss to the entry edge, or close the trade entirely if the price doesn't move as expected.
Therefore, to maintain survival, we must always consider the opportunity for rescue in trades.


Cost of Trading:
Novice or unaware individuals tend to focus on the risk-to-reward ratio of a trade. However, both the likelihood of reaching the maximum safety level (stop-loss) and the amount of price progress within the profit range are not determined at the time of entry into a trade. If we give more probability to the activation of the maximum safety level than we should, it's not logical or rational because if we are confident about the profit amount, why not trade with the highest possible volume to maximize profit? So, what should we consider? The cost of trading.
In "Initial Risk Management Opportunity," we learned that we should have sufficient distance from the entry edge to the first obstacle for initial management. Also, considering the amount of remaining price progress in the new direction, based on the "role of probabilities," which I will discuss in the following sections, is a measure of the cost of trading. Whether this investment opportunity has a cost according to our safety level threshold or not? It's true that entering a trade based on price clues has a high chance of success, but what's certain at the beginning of any investment is the cost. Of course, the cost can be reduced after entry with proper trade management, just as the maximum profit can be obtained with an exit strategy.
Volume Management in Line with Performance: "Alignment with Reality"
Everything discussed so far has been related to the personal capacity and capability of the trader. However, choosing the appropriate volume for each trade depends on the trader's capital amount, which must be in line with the "reality principle."
Just as we use reality checking to search for opportunities by evaluating price behavior clues, we must also choose the best volume for each trade in line with the reality principle.
There are several models for determining trade volume:
- Fixed percentage
- Step fixed percentage
- Less loss than maximum loss so far
- Larry Williams
- John Kelly
- Advanced John Kelly
- Mount Amir
- Incentive
Based on your experience, I prefer you watch the explanation of each in the section of Chartical Cabin Calculations in video format to learn how to use the calculator simultaneously.
Exit Strategy: "Emotion Control"
With the start of a trade and the change in profit and loss due to price movements, emotions are aroused. After various emotions are stirred up, the following tensions arise:
- Loss of profit.
- Loss of capital.
- Loss of profit along with capital.
- Doubt in entry.
- Doubt in analysis.
- Doubt in choosing the correct timeframe.
- The trade is good and should not go wrong.
- The trade started poorly but must end well.
- I've been trading for a long time.
- I'm trading against someone.
- It should be closed with profit at least like the previous trade.
- It should not be closed with loss like the previous trade.
- It should at least close like the previous trade.
It's impossible not to experience at least one of the above tensions in your trades. Having an exit strategy in trades, due to the control it provides over emotions, prevents or reduces tensions.
Types of Exit Strategy Execution:
- Candle to candle.
- Rotation to rotation.
- Initially candle to candle, then rotation to rotation.
- Going to a lower timeframe.
- Obstacles ahead.
- Weightlessness.
- After a large, unusual candle, market text.
Each of the above strategies can be used individually or in combination. Due to the variety of different situations and the fact that the exit strategy heavily depends on the current price behavior, and also considering that price behavior changes in different time periods, learning the details and important points of the exit strategy in live coaching sessions held in Chartical Cabin, where you can learn practically on live charts.
Webinars, workshops, and Chartical coaching sessions are available for free in the Chartical Cabin. chartical.com
5 - Journal Analysis: "Acceptance of Reality"
The only master of trading is the market, and its language is journal analysis.
For example, in forex, where the market is closed on Saturdays and Sundays, novice or unaware traders often review and evaluate their trades from the previous week. Their goal is to find solutions to strengthen their abilities and address their weaknesses for better trading and higher profits. Although they may achieve some insights and start trading on Tuesday with a sense of discovering the key to secrets, they will still experience unexpected results and feel frustrated. This cycle repeats endlessly. Starting on Sunday with a sense of hopelessness about success and striving to discover the key to secrets, ending on Monday with excitement about potential profits in the upcoming week, and ending the week frustrated with the outcome of their trades; the key to secrets is not found by reviewing non-principled and ineffective methods.
Some other traders in this category, after becoming disappointed with the effectiveness of their current method, search for another method that may be the same as a fundamental and effective method; this group of traders also remains in this cycle indefinitely.
"It is impossible not to have experienced at least one of the above tensions in your trades. Having an exit strategy in trades, due to the control it exerts on emotions, prevents or reduces tensions.
Types of Exit Strategy Implementation:
- Candle by Candle.
- Rotation by Rotation.
- Candle by Candle then Rotation by Rotation.
- Going to a lower time frame.
- Obstacles.
- Weightlessness.
- After an unusually large market move.
Each of the above strategies can be used singly or in combination. Given the diversity of different scenarios and the fact that the exit strategy depends heavily on the current price behavior, and also considering that price behavior changes over different time periods, the details and important points of the exit strategy will be learned in live coaching sessions that I will discuss in the next sections.
Webinars, workshops, and Chartical coaching sessions are available for free in the Chartical Cabin.
5 – Journal Analysis: "Acceptance of Reality"
The only master of traders is the market itself, and its language is journal analysis.
For example, in Forex, where the market is closed on Saturdays and Sundays, novice or unaware traders often review and examine their previous week's trades. Their goal in doing so is to find solutions that strengthen their abilities and address their weaknesses in order to achieve better trades and greater profits. Although they may find some issues and feel like they've unlocked secrets, they start trading on Monday and will still experience unexpected outcomes, feeling disappointed. This cycle repeats endlessly. Starting on Sunday with a sense of disappointment over past week's successes and searching for secret keys, ending on Monday with excitement over anticipated profits in the coming week, and ending the week disappointed with trade outcomes; unlocking secrets does not happen through unprincipled and inefficient analysis.
Some others in this category of traders, after becoming disappointed with the effectiveness of their current method, search for another method that may be the very method that is principled and effective; these traders also always remain in this cycle.
So how have others succeeded and reached their financial goals through trading? With five simple steps:
1. Realistically, without daydreaming and paying attention to flashy advertisements and tempting offerings from signal sellers and educational packages, they look at the profession of trading.
2. Like any other profession, they seek educational resources and acquire a scientific skill that is mixed with experience, while adhering to standards.
3. They analyze the quality of performance based on the "acceptance of realities" by registering and analyzing trade journals.
4. They update their trading rules based on the results of their personal trade journal analysis.
5. They stick to their rules.
The first and second steps are up to the end of the exit strategy section, and the third step onwards is up to the end of the seventh section.
As mentioned above, the third step is done through analyzing the quality of performance, through the registration and analysis of trade journals, based on accepting realities. As long as we are in contact with the market through language (the result of trade journal analysis), our trading method will not be outdated, always acting in line with the current price behavior and being able to find the best symbol and time frame suitable for our trading.
What should be recorded in the journal?
- Choices.
- Decisions.
- Psychological factors affecting trade outcomes.
It will not be important that the entry and exit times, the spread amount, commission, and any information unrelated to the issues, whatever they are; although some of this information is used in the "trade performance analysis" that we will discuss in the future, it has no relation to the "journal." The priority of analyzing journal reports lies with the psychologist or coach, so that they can provide the best advice based on their knowledge, skill, and experience; however, you can also use journal analysis to some extent yourself.
Given that storing, processing, and updating journal algorithms require strong technical infrastructure and knowledge, I have provided the trade journal application for you, which has the following features:
- Derived from observations and experience of over 80 hours of psychological workshops by the head of psychology of the Chartical collection and psychological counseling for over 200 traders.
- Derived from 20 years of trading experience.
- Derived from 9 years of trade analysis and other journal experience.
- Always available on any device (desktop, tablet, mobile).
- Permanent storage of information.
- Display of specialized analysis results of journal reports visually.
- Practical for any trader in any market and with any trading method.
To use the Chartical journal, you must visit the Chartical website cabin (chartical.com). You can send your journal counseling requests (by me (from the perspective of a trading expert) or by accredited psychotherapists of mine) through the website.
6 – Updating the Trading Checklist: "Continuous Growth"
Given what has been said, the results of journal analysis are the language of our communication with the market; therefore, we must use these results to update our trading checklist. In this case, we can have trades that are proportionate to price behavior changes in different periods, and as a result, achieve sustainable profits; this means "continuous growth."
Professional specialists in any field always take various ways to update their knowledge and "maintain continuous growth." We as a professional trading expert must also constantly grow in order to achieve sustainable profits. For this purpose, I have provided the trade checklist tool for you to update your trade checklist based on the results of your journal analysis at any time.
The most fundamental basis for using the checklist is that: The trend is not a trader's best friend, but the trading checklist is.
Trading in line with the trend is one of the prerequisites for successful trading; if it's not there, there shouldn't be any trading at all. However, the friendship with the trend is not that vital and is only for the sake of continuing growth after success.
The main advantage of using the checklist:
- Preventing deviation from your rules.
- Preventing forgetting rules during trading.
- Adhering to your rules.
- Reducing human error.
So, for the sustainability of success and continuous growth in trading, friendship with the above conditions must accompany us."
7 – Adherence to Your Own Rules: "Self-Respect"
From the moment we are born and step into the vast and unknown world, security becomes our primary need, and we will constantly pursue it, whether consciously or unconsciously. As we grow older and become more familiar with our world, we realize that we must connect with the world outside ourselves and gradually accept that every relationship requires adaptation to differences and internalization of the norms of the external environment. Trial and error have been the most obvious way to learn these norms, and with the consequences of this trial and error, we decide to repeat some behaviors or eliminate and avoid others. Ultimately, the collection of repeated behaviors in us will shape our characteristics and habits and reflect our personality. A personality that we have worked hard to build and cherish despite all its flaws and is precious to us.
The same process is repeated in the formation and growth of our trading personality. A mature and healthy trading personality that enters the trading arena with the aim of making a profit knows that before seeking profit, they must ensure their survival and security by taking sufficient care of their trading account. They know that the market, like their world, is vast and unpredictable, so they must ensure their highest level of security by setting appropriate financial and psychological stop-loss levels.
Regardless of whether the price movements are favorable or unfavorable, they enter their trades and assess the chosen volume only by considering its profitability. Every choice they make has its cost, and they must consider their trading volume in proportion to the agreed-upon terms. After opening their trades, they remain aware of all their positive and negative emotions and base their decisions on their trading expertise.
With the conclusion of their trades, whether with a profit or with a loss, they first record their experience before taking any other action, and they meticulously document their trading personality in their journal, embracing all the realities of their behavior. They review their collection of trading behavioral traits, both strengths and weaknesses, classify them systematically and practically, and draft their trading checklist before the market judges them.
They always repeat this process and never cease studying their trading behaviors before studying anything else. But this continuous growth, this healing process, requires acceptance unconditionally, with all the flaws and virtues of their behavior.
They see their weaknesses without any blame, accept them, and strive to address them. They also value their trading personality and cherish it. They consider their strengths with the same attention to their weaknesses and recognize their strengthening as the basis for their future trading decisions and behaviors.
If this self-respect, this acceptance exists, and they recognize their trading personality formally, adherence to their self-made and self-discovered rules will be practical, and they will witness their profitability or maturity.
What every trader should know:
Trading is not gambling;
Many members of society believe that trading is gambling, which is not true. Gambling means testing luck, with no choice or intervention affecting the results, as you can never carve the corners of a die or distribute the weight in a way that favors the desired number. But in trading, the situation is different. Through techniques and clues, you can choose suitable trading positions that are more likely to succeed. That is, you can distribute the weight at the center of the die or any other point in a way that the desired number is more likely to occur.
Another important point that prevents working in financial markets from being like gambling is that we have two very powerful tools; one is trade volume management, which includes various volume calculation models available in the Chartical Cabin, and the other is the exit strategy. I explain the exit strategy in this book.
The role of probabilities in trading;
In the early stages of engaging in trading, when there are many ambiguities and challenges for each person, some uneducated individuals who have unfortunately been trained on social networks, due to lack of awareness and sufficient study, talk incorrectly about the role of probabilities in trading, depriving others not only of the benefits of the role of trading but also spreading an insecure image of this profession.
One of the concepts of probabilities that we deal with in every trade is risk. The true meaning of risk is the probability of success. The lower the probability of success, the higher the risk; and the higher the probability of success, the lower the risk. In fact, what makes risk management is everything that was discussed in sections 1 and 2; not determining the trading volume! The name of this act is volume management.
Another application of probabilities in trading; Imagine in a city, a very destructive earthquake happens approximately every 100 years. How concerned will the city's people be about its recurrence if the last earthquake occurred 20 years ago? If it was 50 years ago? If it was 90 years ago? And if it was 120 years ago, what is the level of concern? Naturally, the closer the time of the earthquake occurrence, the higher the probability of its occurrence; and even after the estimated time has passed, the probability of its occurrence will increase more and more. The continuity of price movement in steps is also based on this rule; the farther the price moves from the starting point of the step, the higher the probability that it will not continue; this real concept is the "cost" of trades.
Trading Opportunities Tailored to Current Price Behavior - 2024
Reversal Opportunities:
With these opportunities, we enter the trade at the earliest signs of price movement in the direction of a new trend; meaning the best price points in the direction of the new trend.
The valuable advantage of reversal opportunities is that we enter the trade at much better prices compared to other traders in the market, and as a result, our profit potential and success probability are higher.
Note:
Always remember that reversal opportunities are only valid within the proximity of the market's price range (above or below), otherwise, you will fall into a trap.
1 - Reversal - Failed to Continue
These opportunities arise due to the inability of the price to continue its movement in the current trend direction.
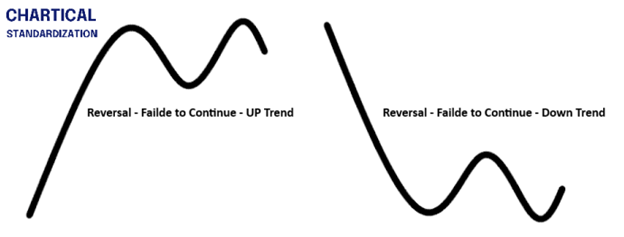
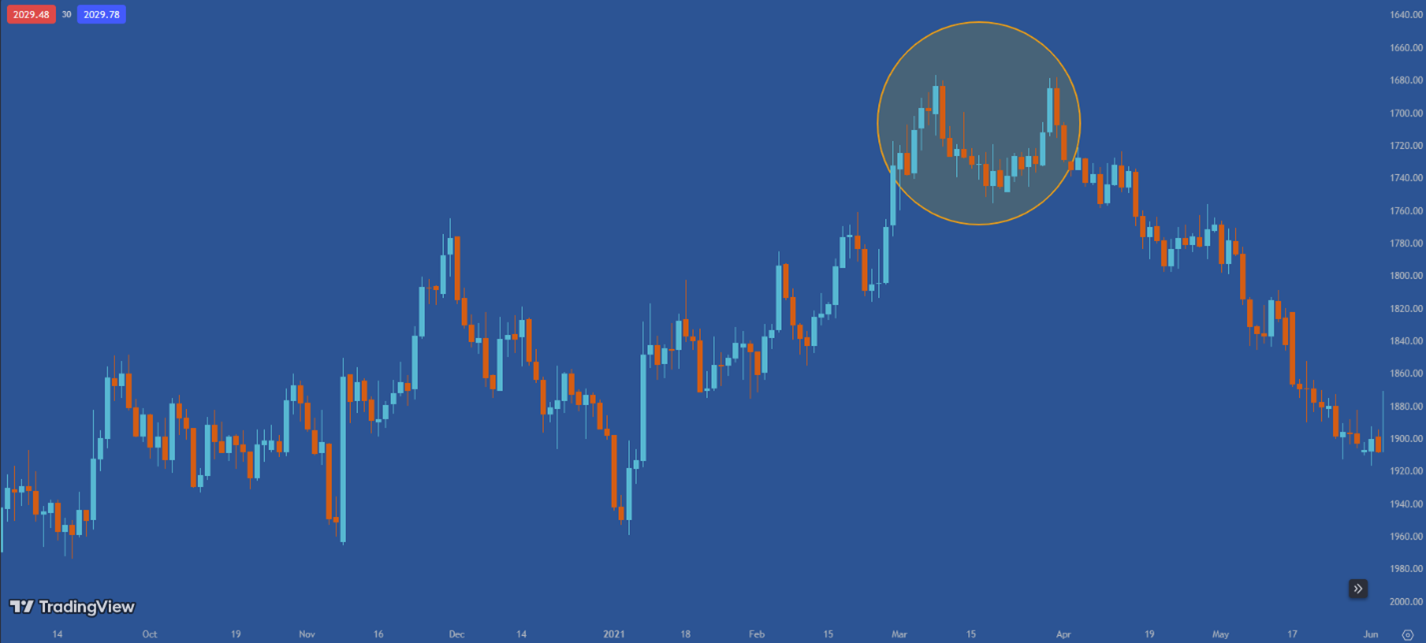
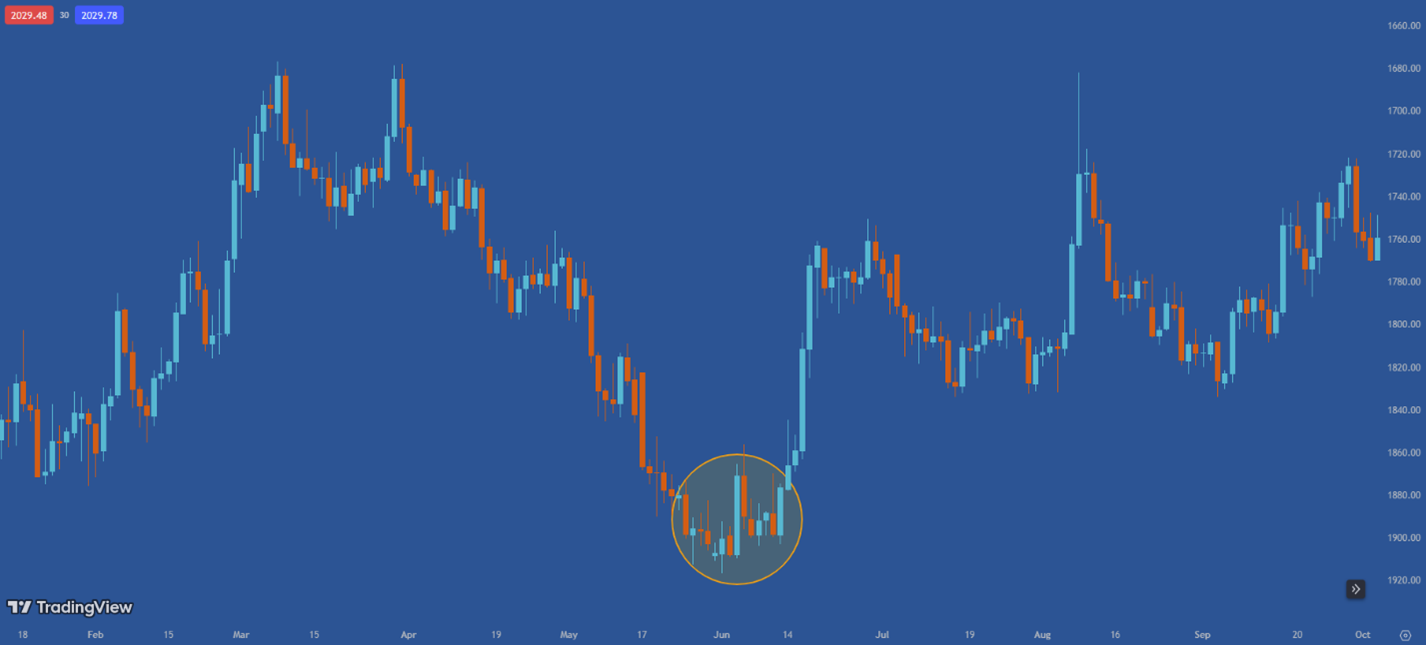
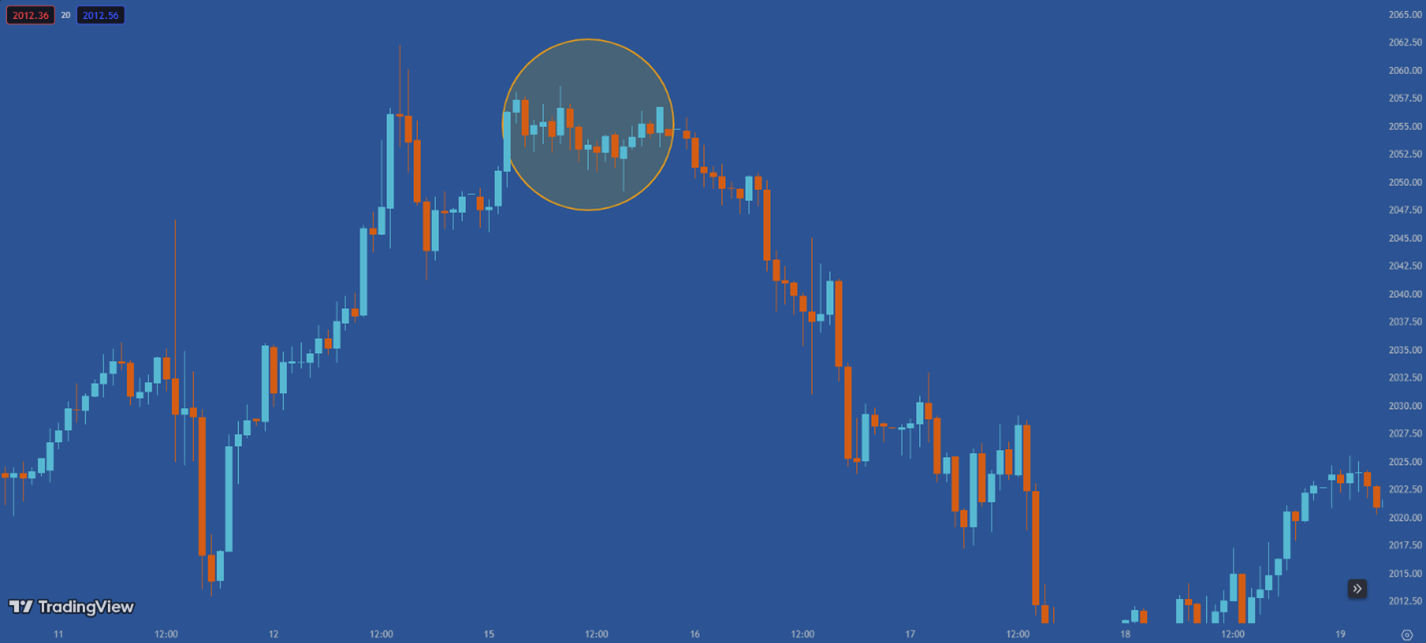
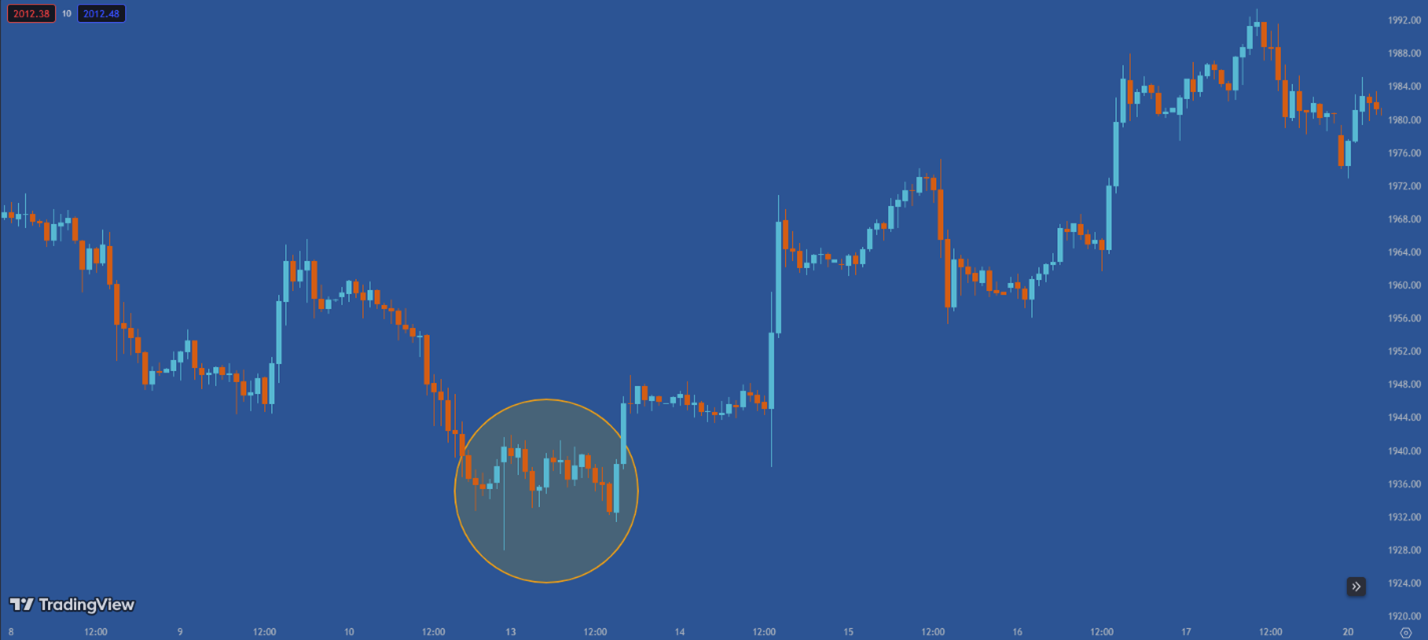
2 - Reversal – Reset
These opportunities arise when major players intend to trade a larger volume in addition to the initial volume at the beginning of a trend.
Major players wait for the price to reach the last range where a massive volume (in the new direction) was traded. Based on the current price behavior, the wicks of these ranges overlap.
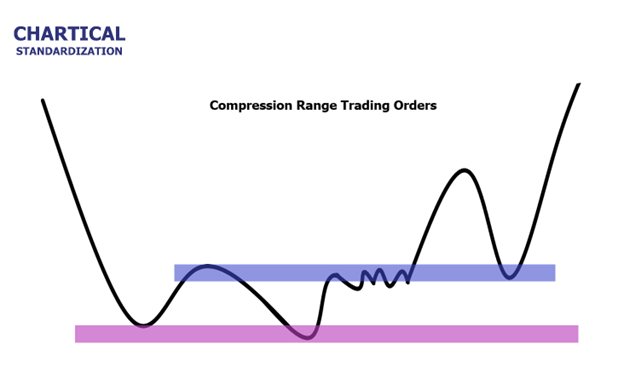
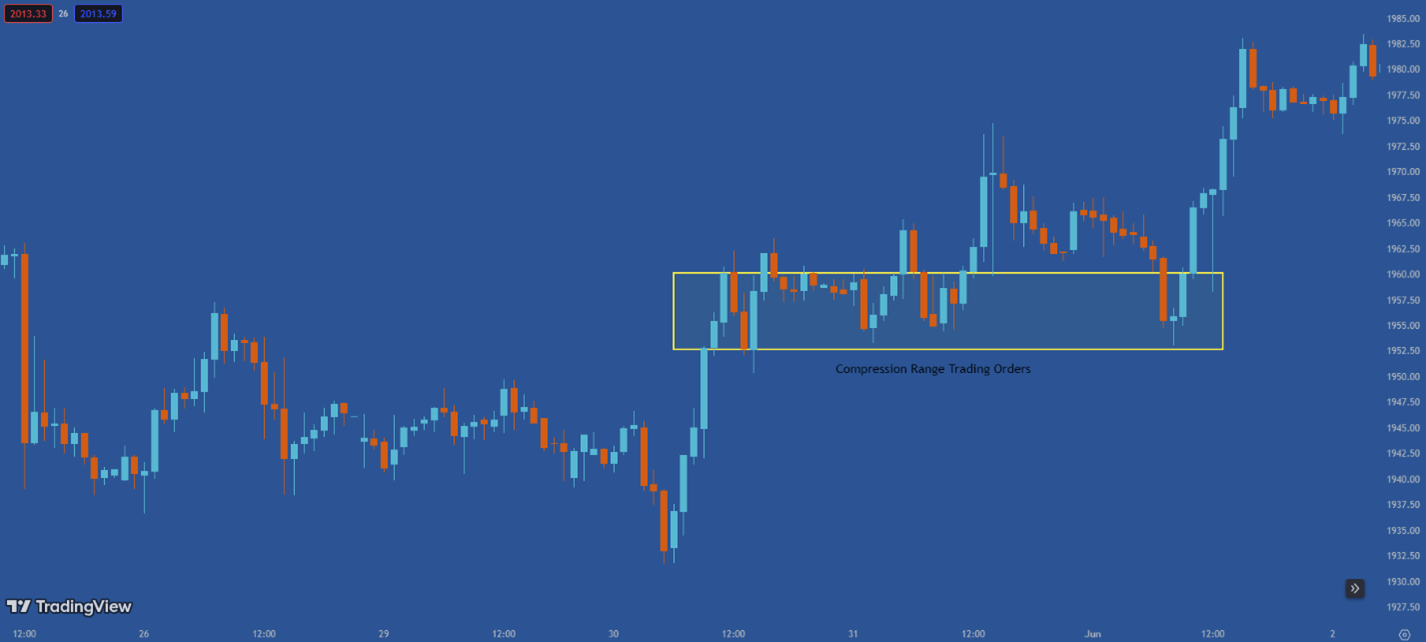
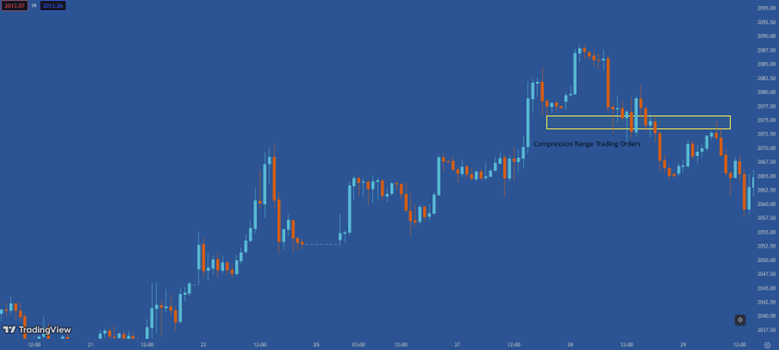
3 - Reversal – Accumulation
When a group of major players remains inactive from the beginning of the trend, they attempt to take advantage of the opportunity to gather trading orders before the price reaches the compression range of trading orders, which leads to further price movement in the new direction.
- Accumulation of Trading Orders: Refers to the process of major players accumulating trading orders.
- Compression Range Trading Orders: Refers to the range where trading orders are compressed before a significant price movement.
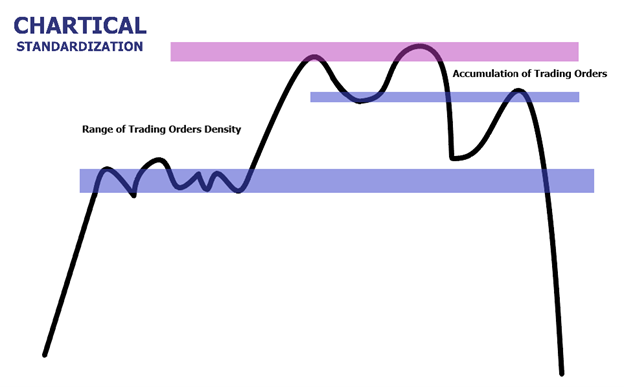
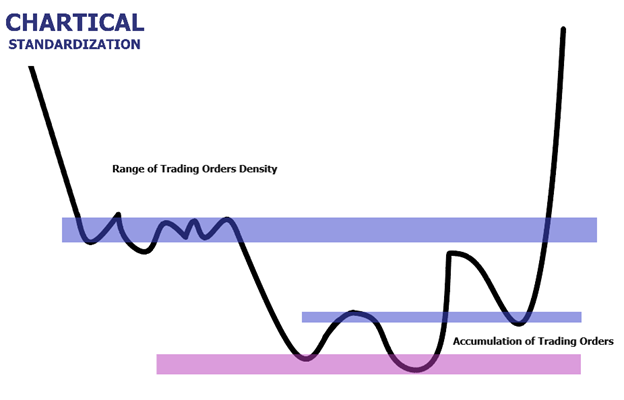
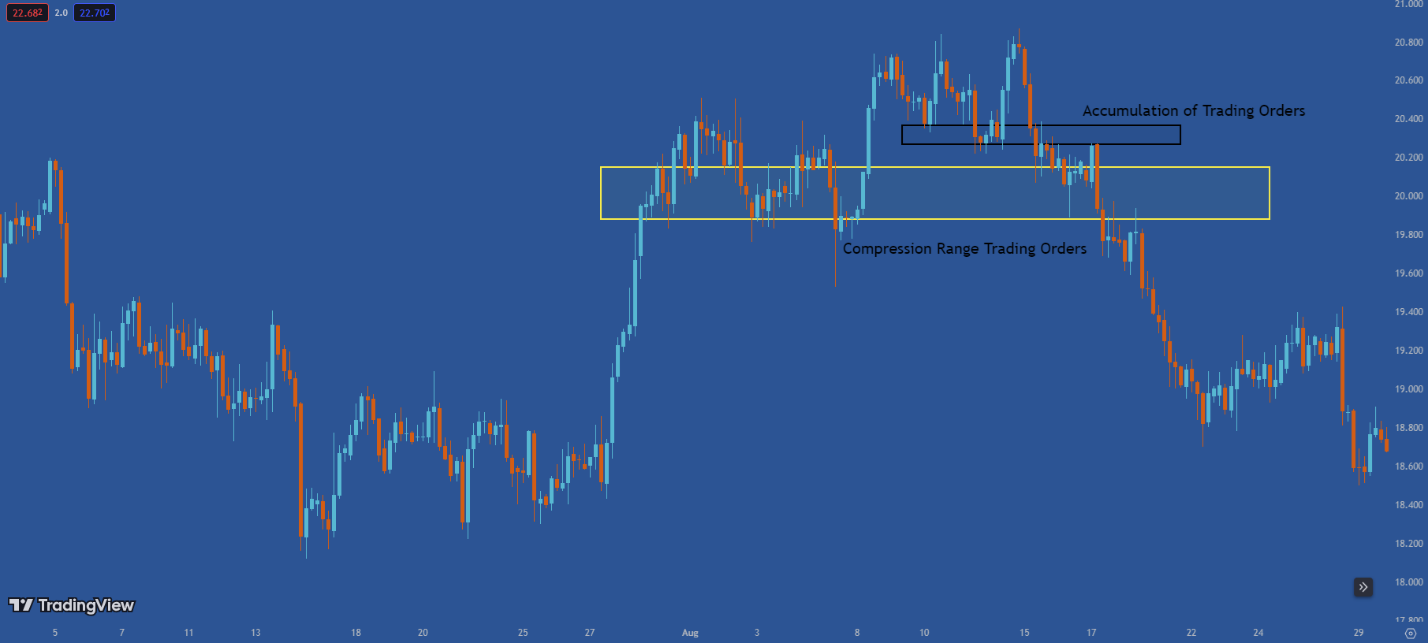
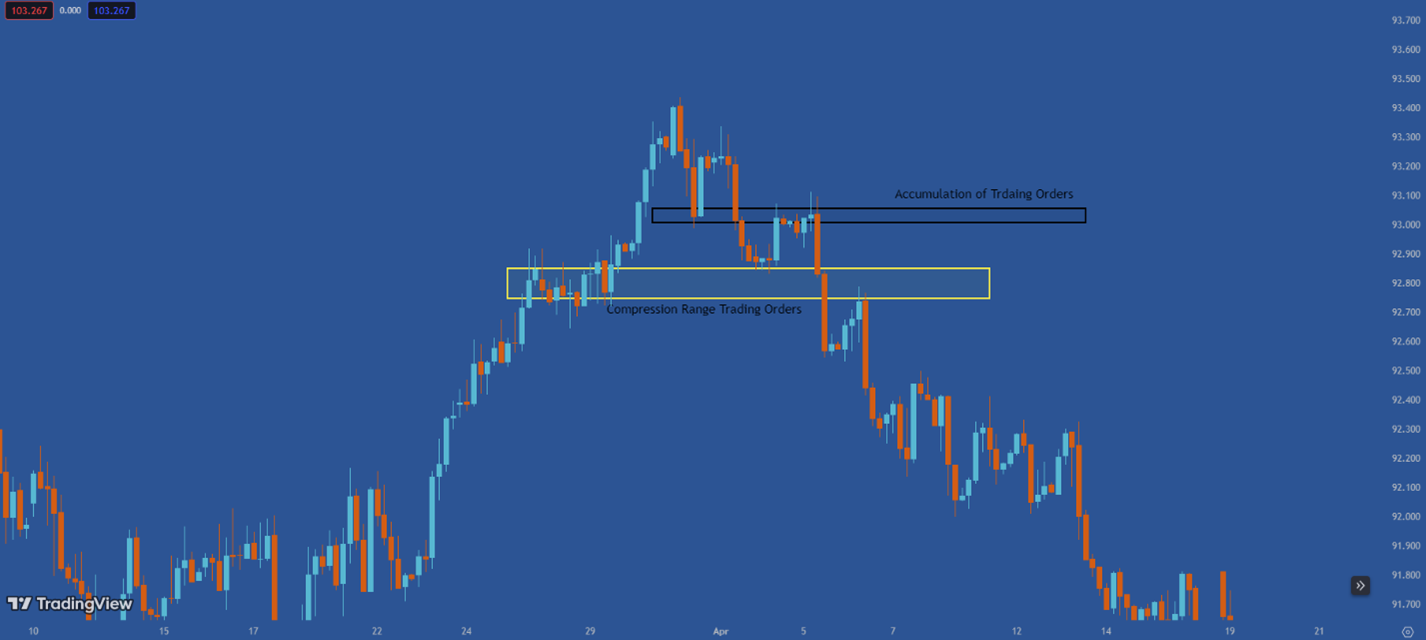
4 - Reversal – Decentralized
In these opportunities, major players do not have a role, and the new trend is initiated by professional traders. This is because the funds of professional traders are not as substantial as those of major players. Consequently, the accumulation of trading orders sufficient to initiate a new trend is not concentrated within a specific range but scattered across a dispersed range.
Note:
The risk associated with these opportunities is higher compared to other reversal opportunities.
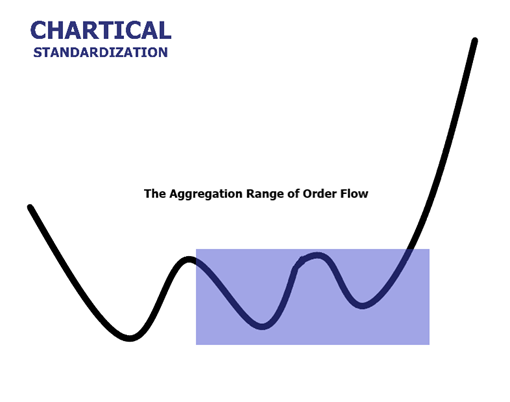
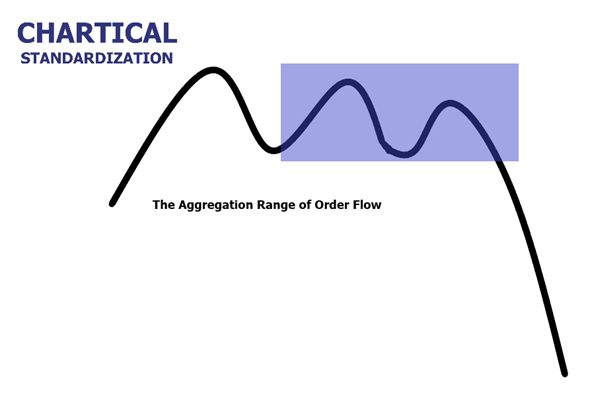
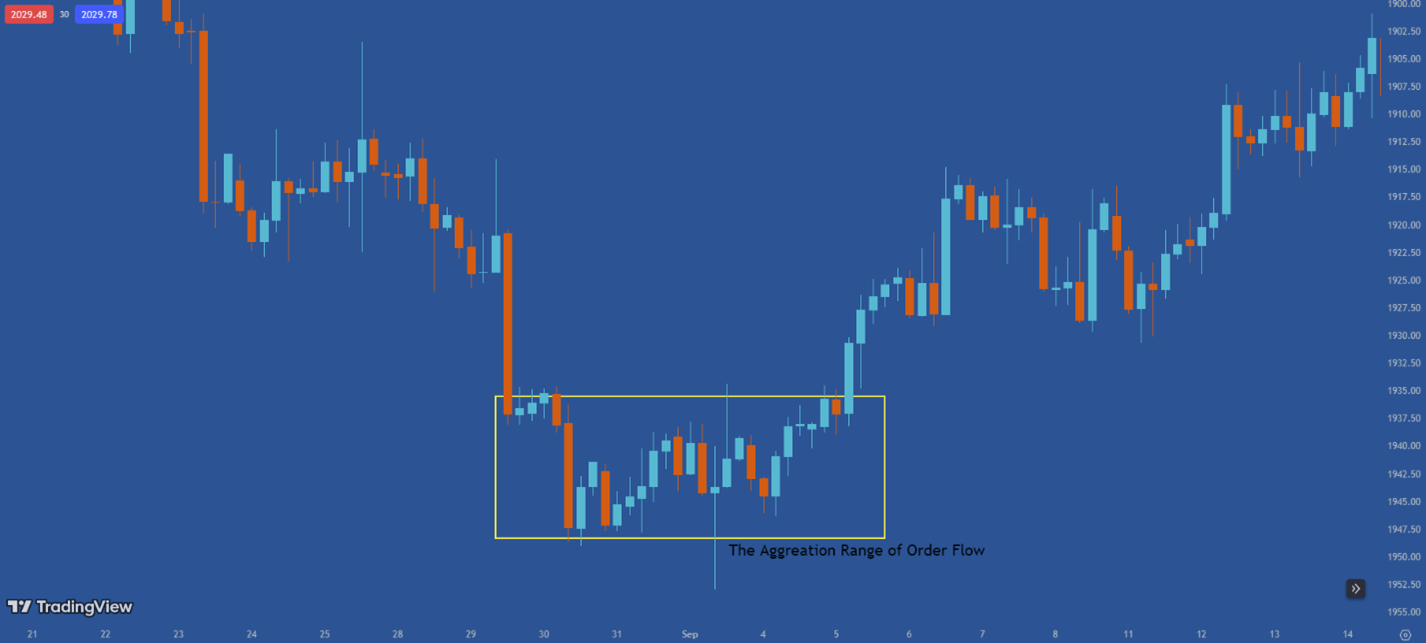
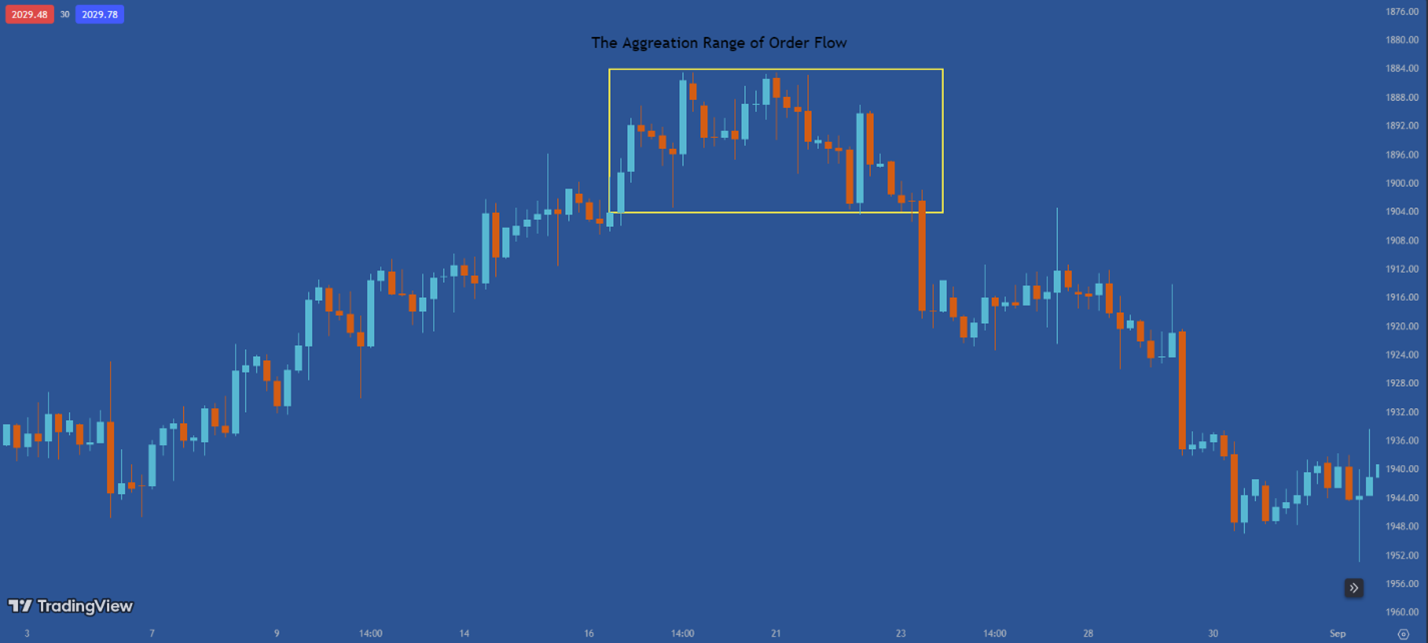
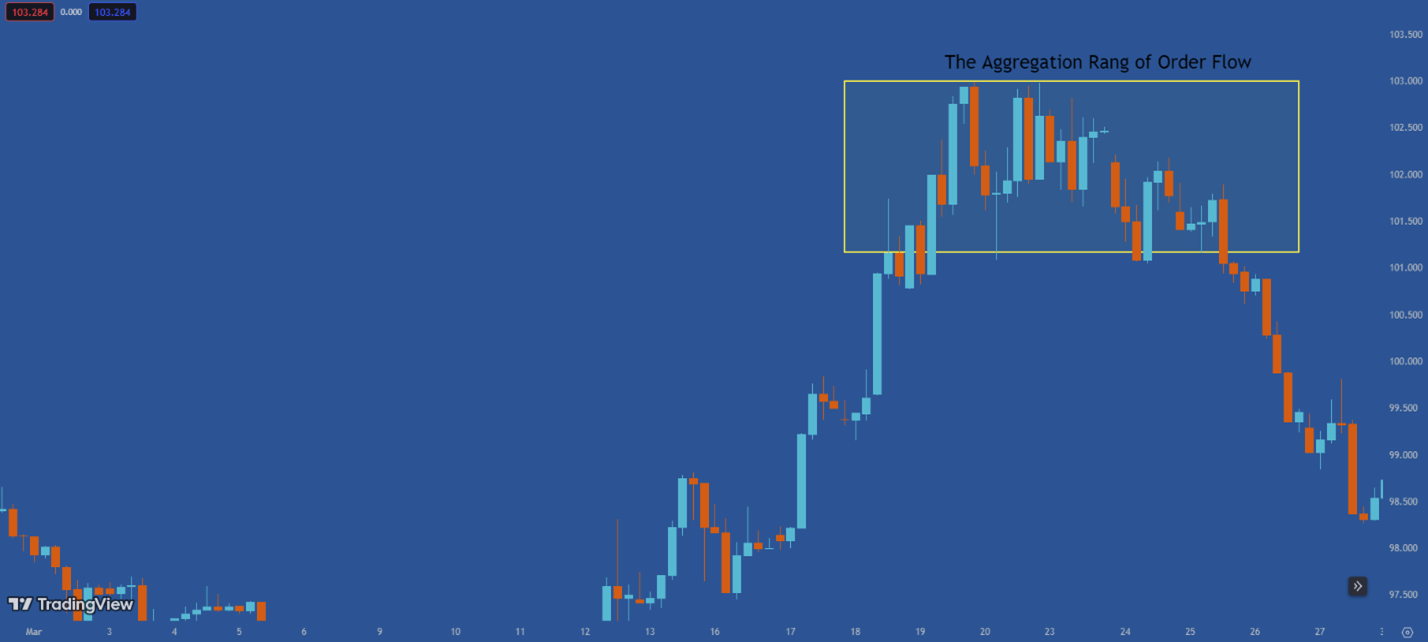
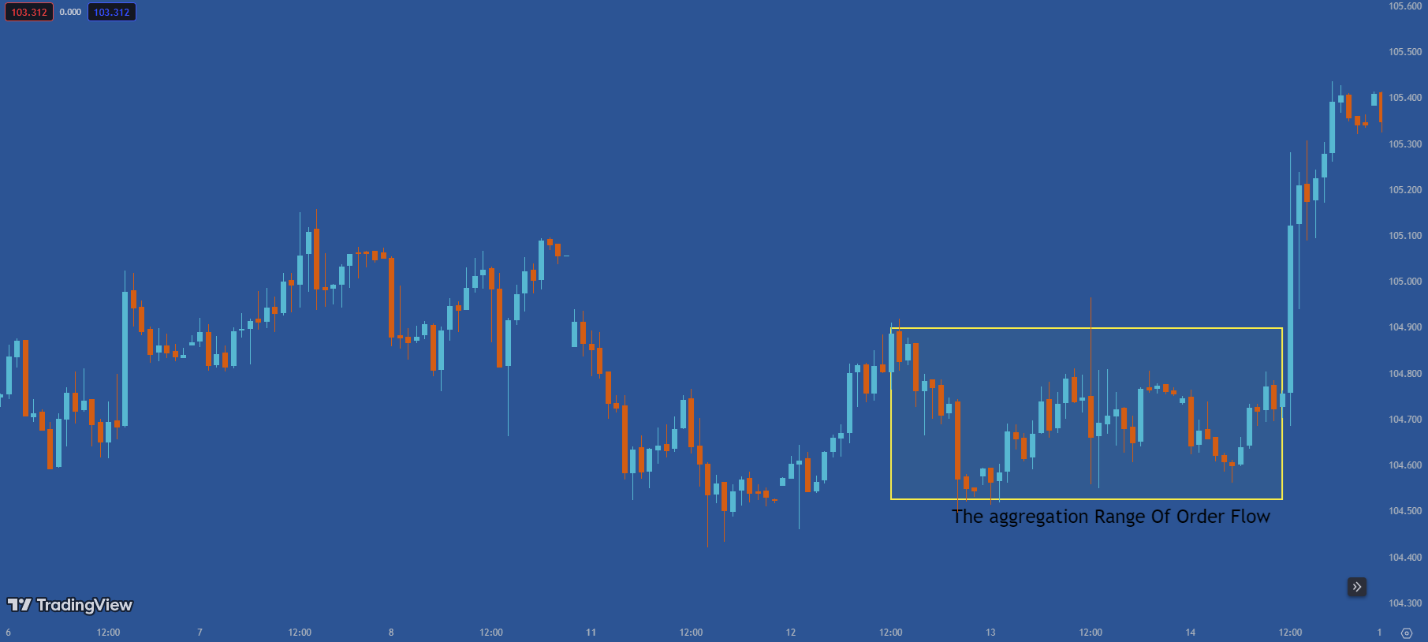
5 - Reversal – Confirmation
These opportunities arise when, after the initial strong move of the new trend, no correction occurs, and the price gradually returns to the range of the initial strong move. In Reversal – Confirmation opportunities, entry confirmation is provided by a rotation within the recent rotation range.
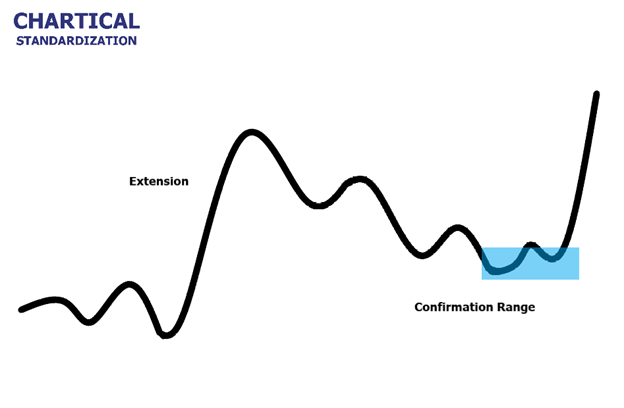
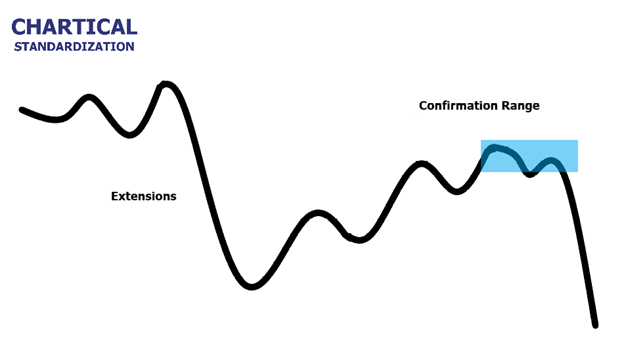
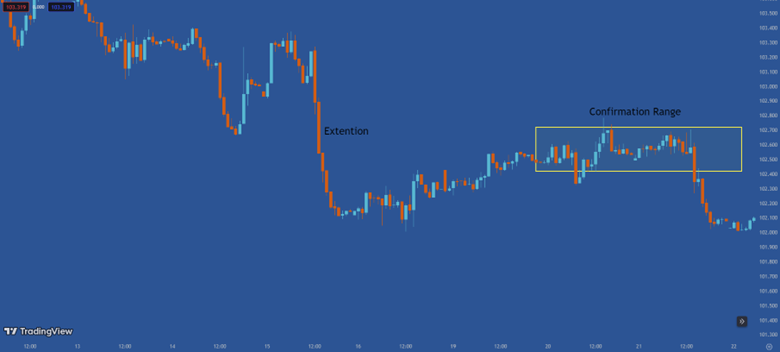
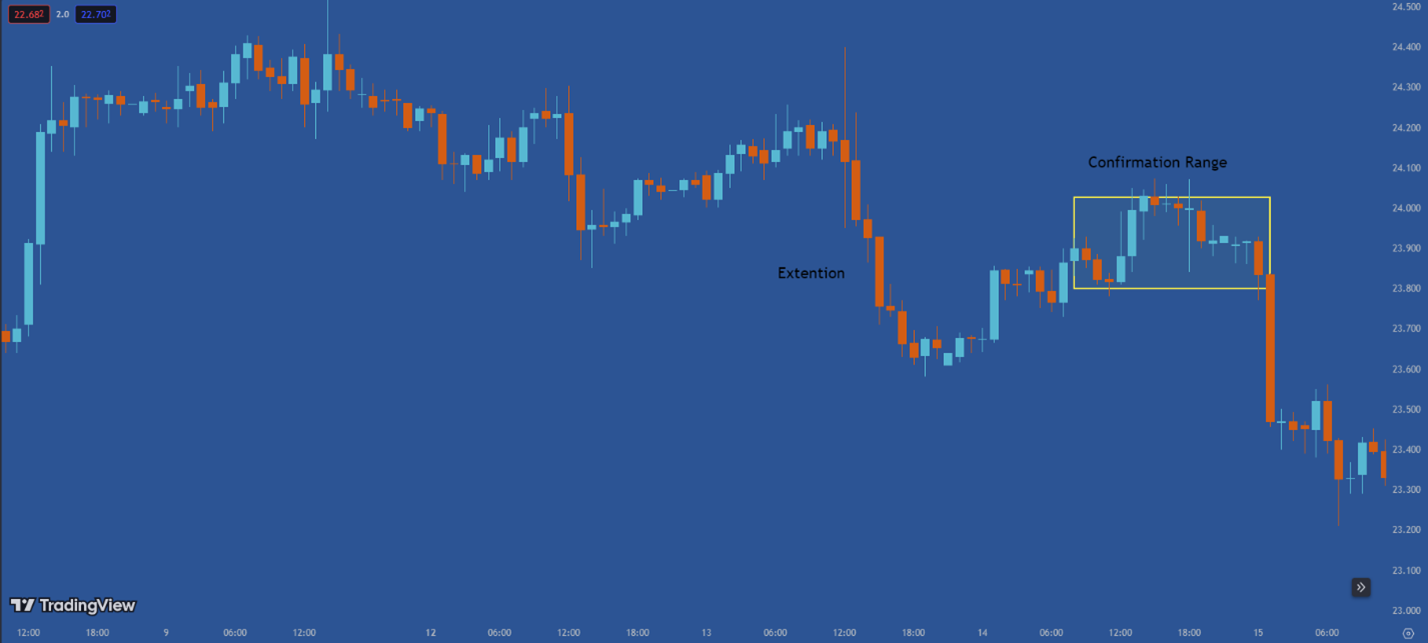
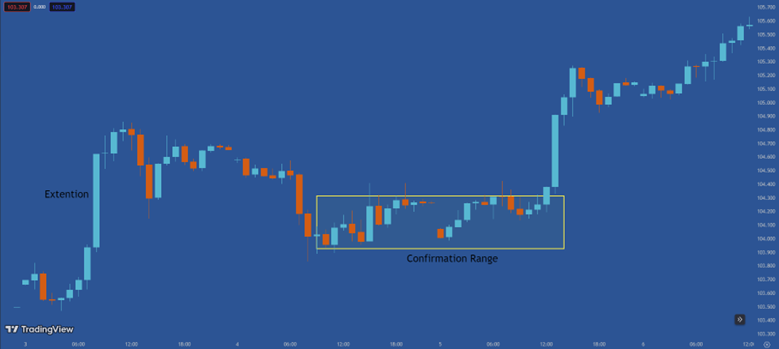
6 - Reversal – Sideways
As I explained in the section on different types of trends, trading can be done within a sideways range. Trading in sideways opportunities does not have any specific points, and general charting principles should be considered.
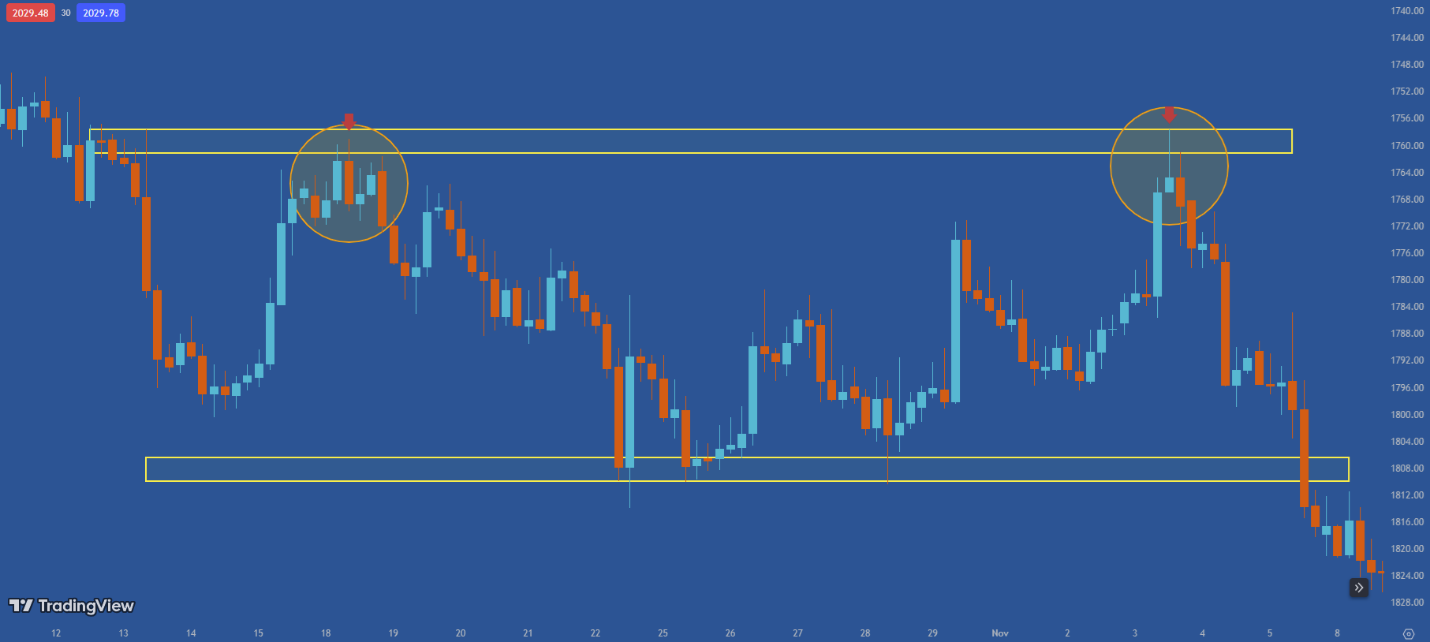
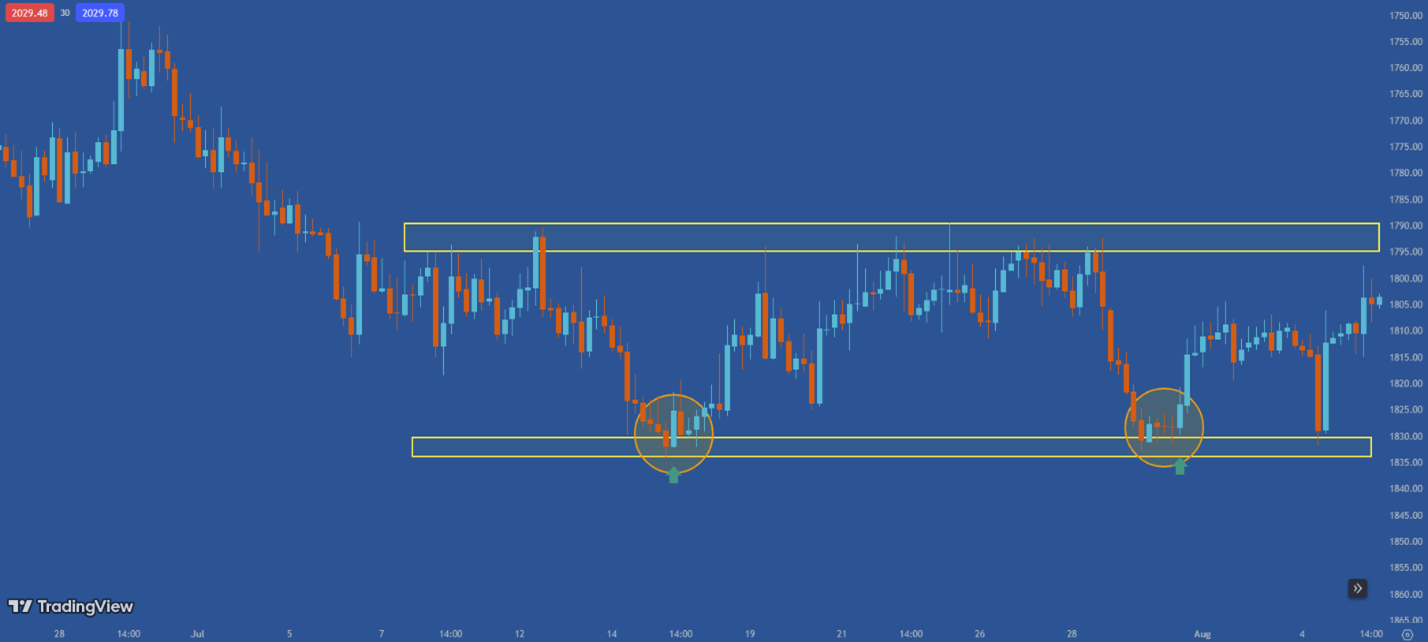
Opportunities to continue:
1 - Continue - Simple
Trading in these opportunities strictly adheres to the rules of the strong move, correction, and trend.
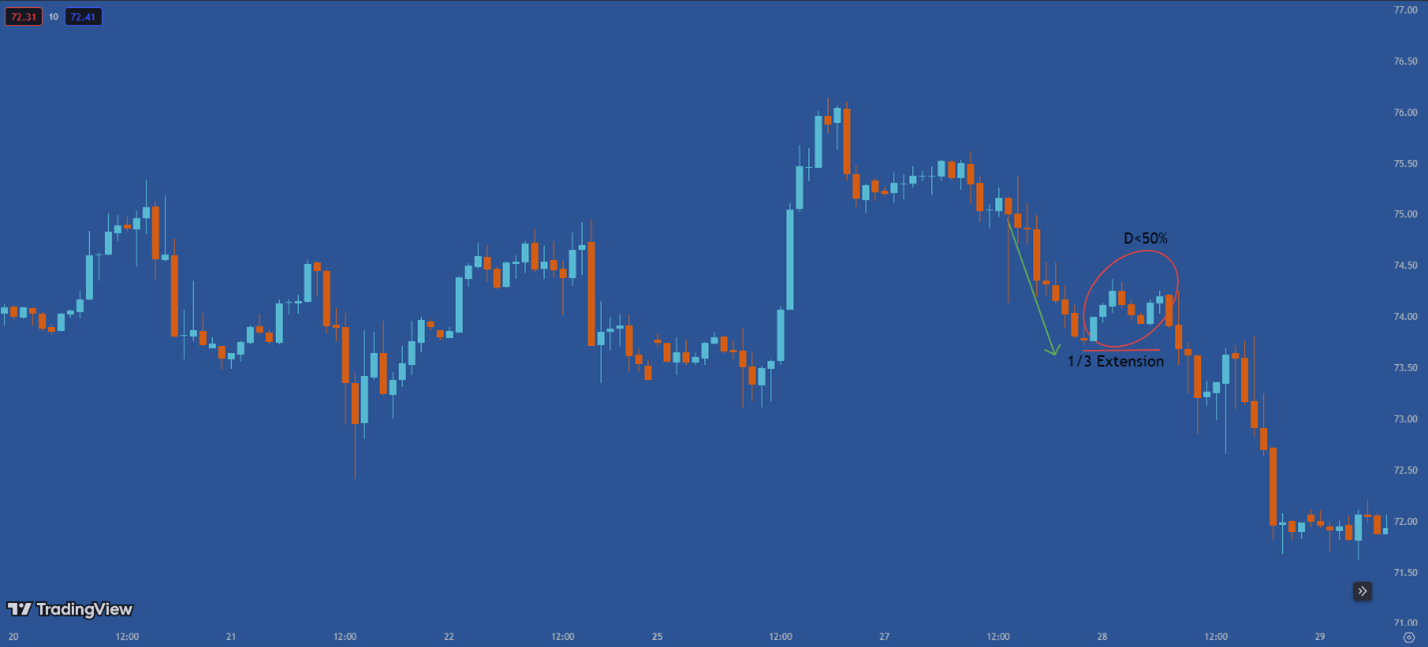
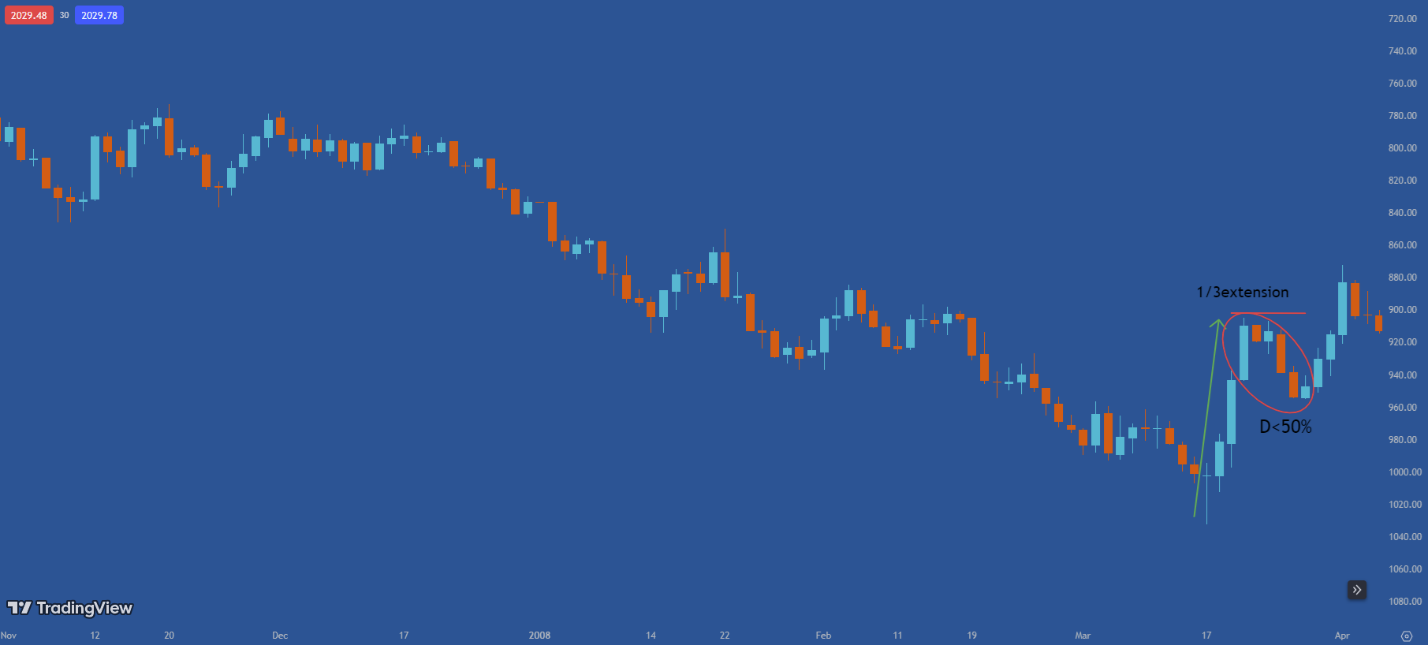
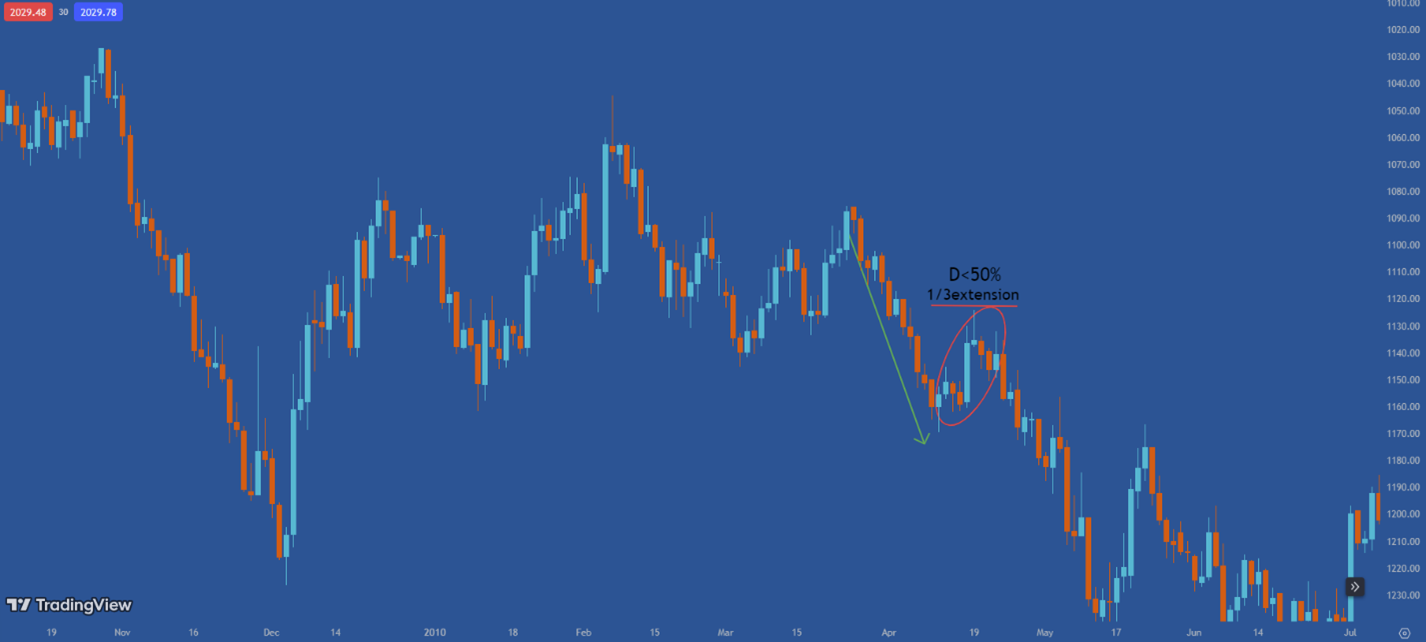
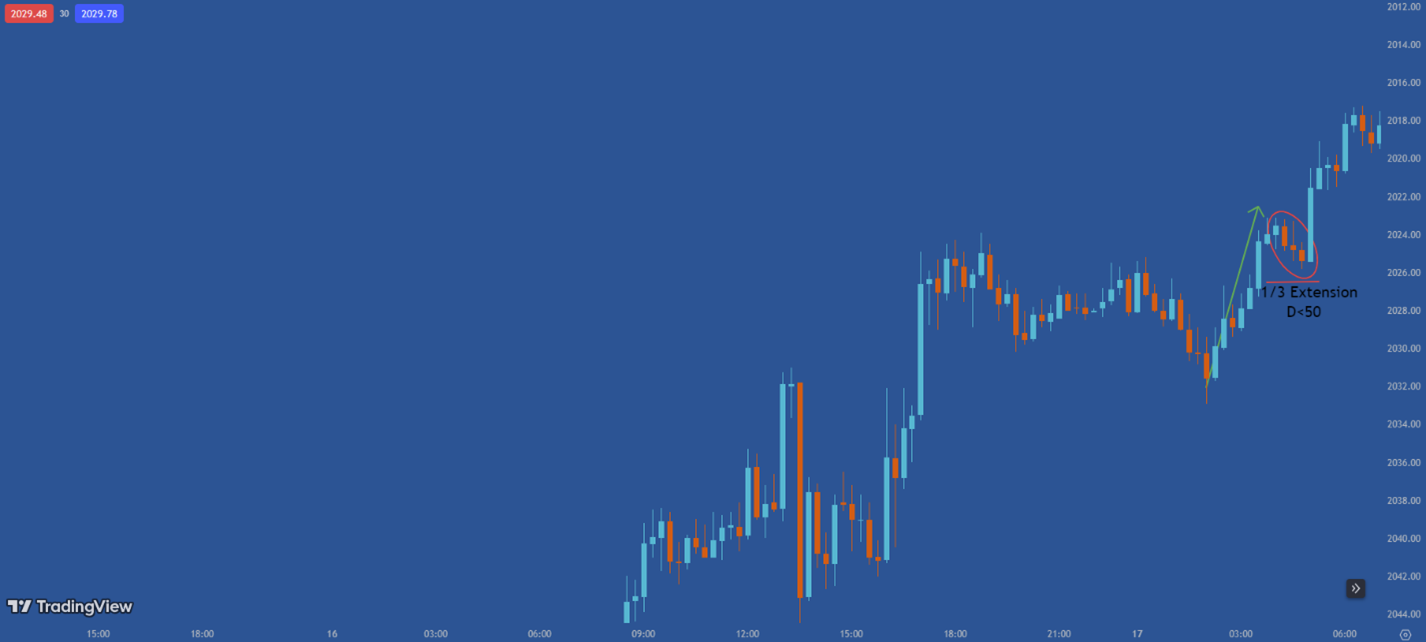
2 - Continue - Reset
In these opportunities, similar to Reversal - Reset opportunities, the main players use the chance of price returning to the last range where a large volume of trades occurred at the beginning of the continuation of the trend. Based on the current price behavior, the candlesticks overlap at the head of these ranges.
Why these ranges are important for the main players should be followed in my weekly live coaching sessions, as I always say, trading opportunities are like unique fingerprints and must be practiced and traded under live market conditions.
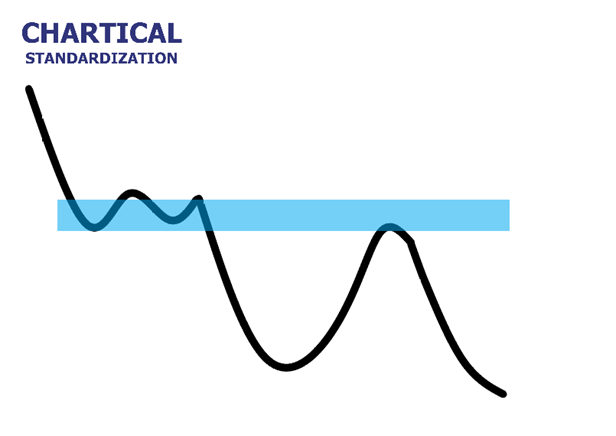
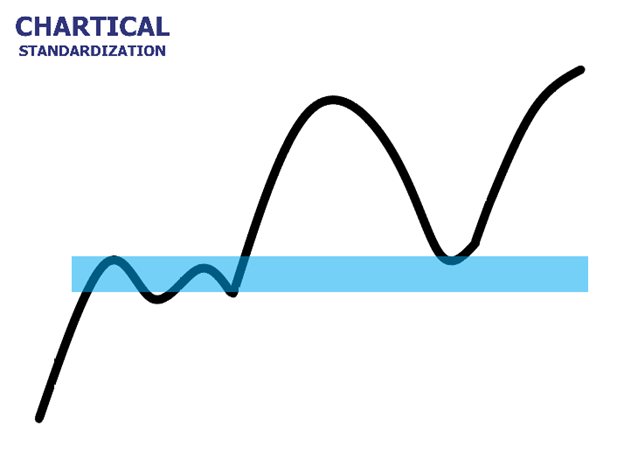
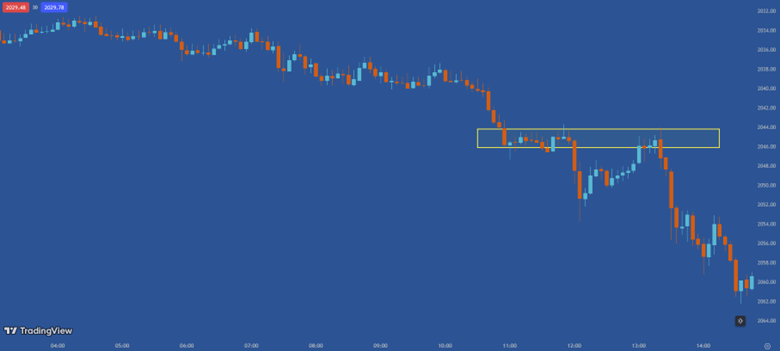
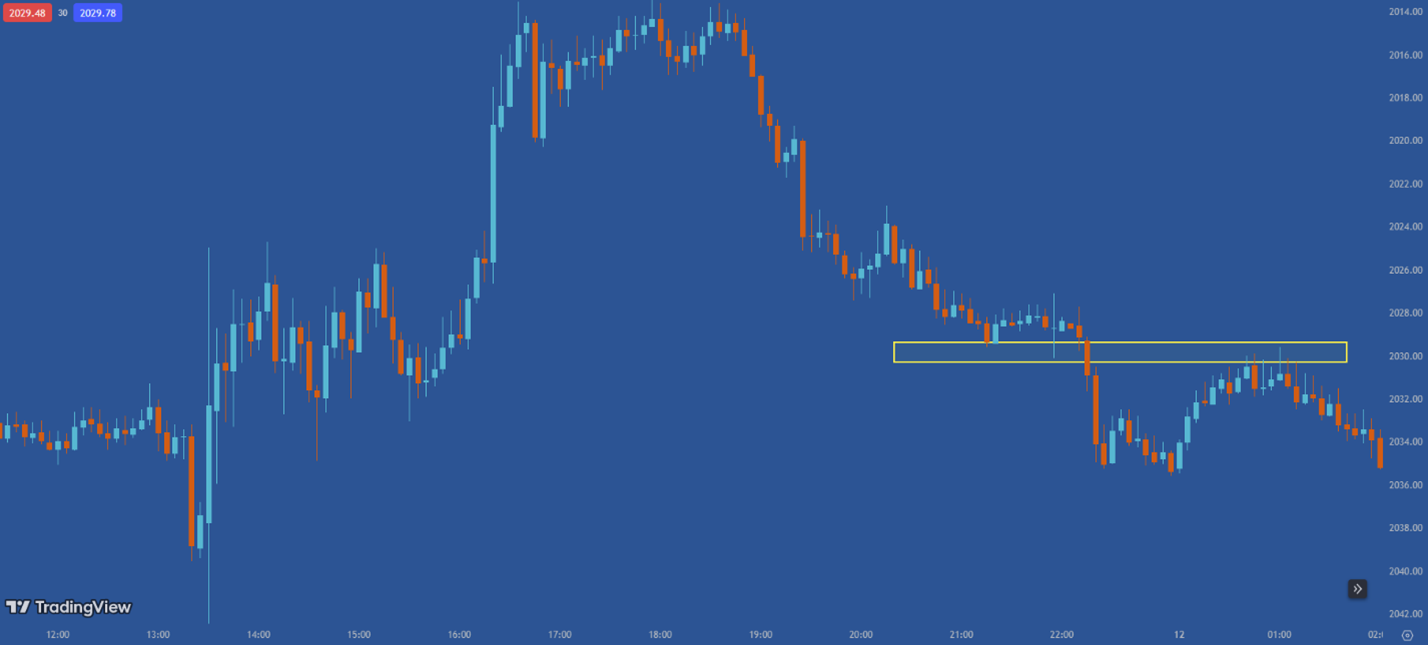
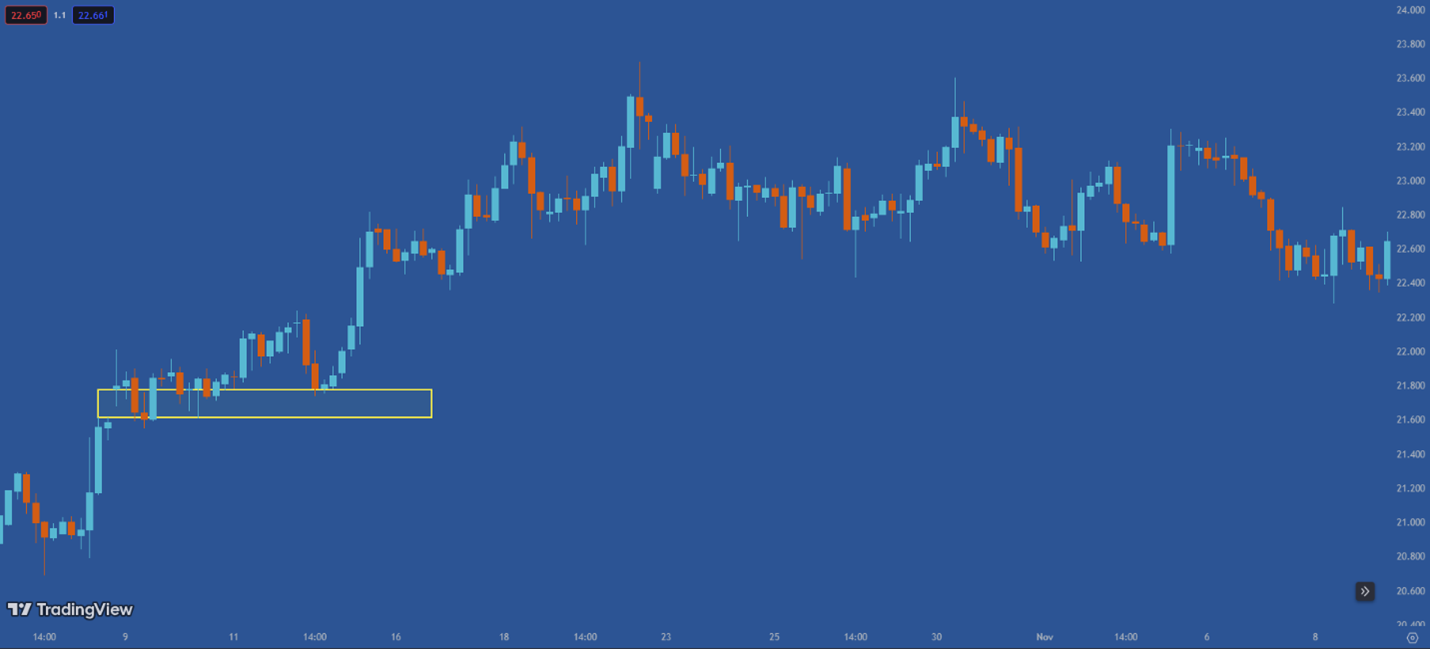
3 - Continue - Accumulation
Continue - Accumulation opportunities arise in weak trend conditions. For reasons that are not important for the trader (because we deal with hows, not whys), the trend continues weakly, but for the new strong move, large traders enter and create a dense range of order flow by trading at better prices within the last accumulation range. Unaware traders perceive this area as turbulent and refrain from entering.
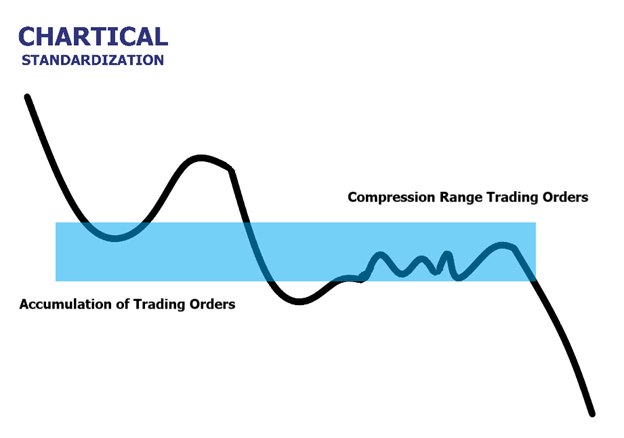
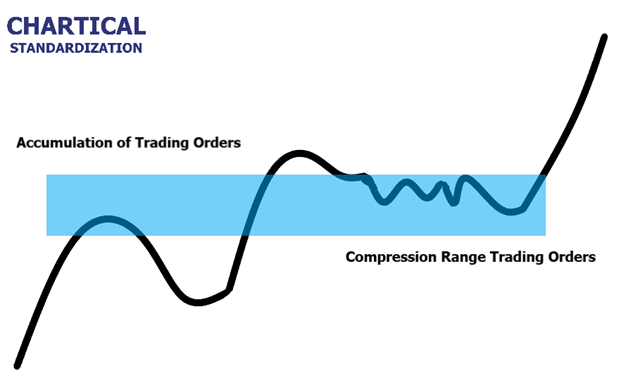
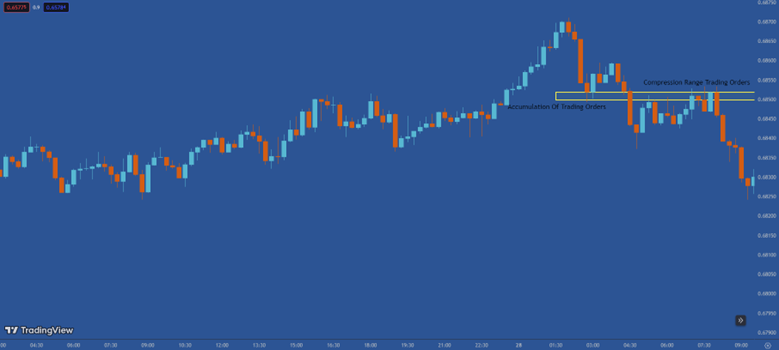
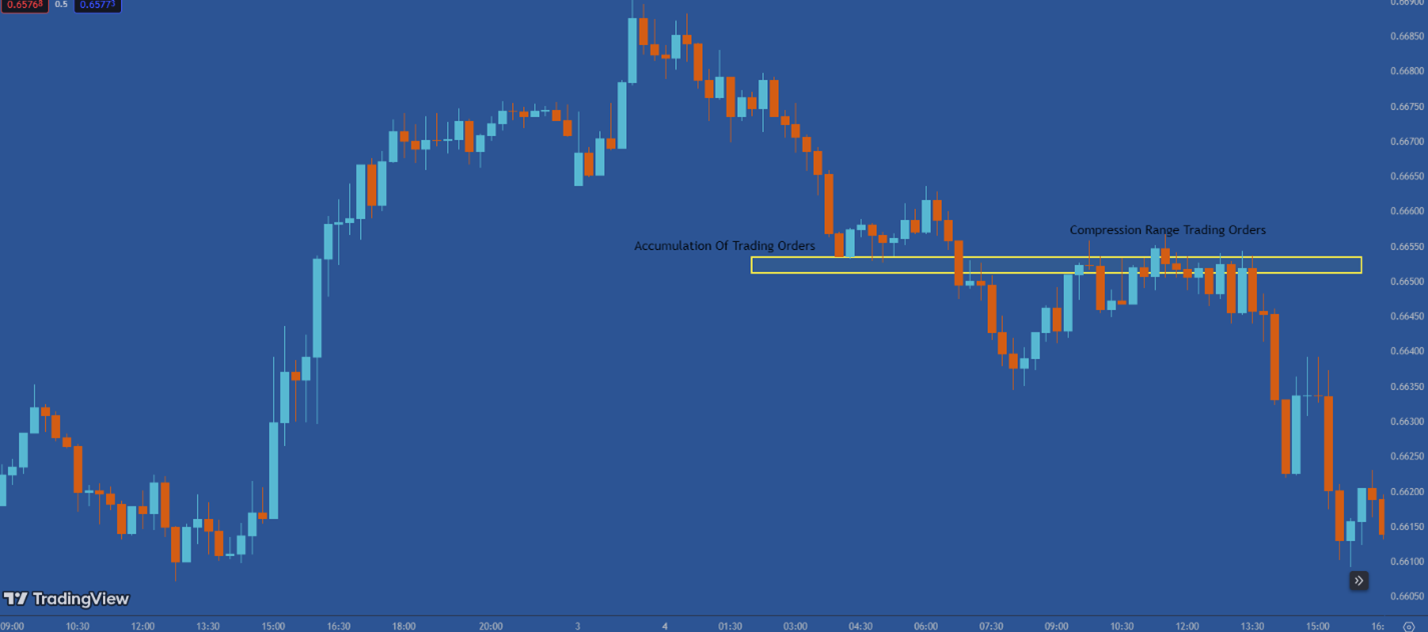
Key Level Opportunities
Key level opportunities are created as a result of price approaching the recent accumulation range.
1 - Key Zone – Confirmation
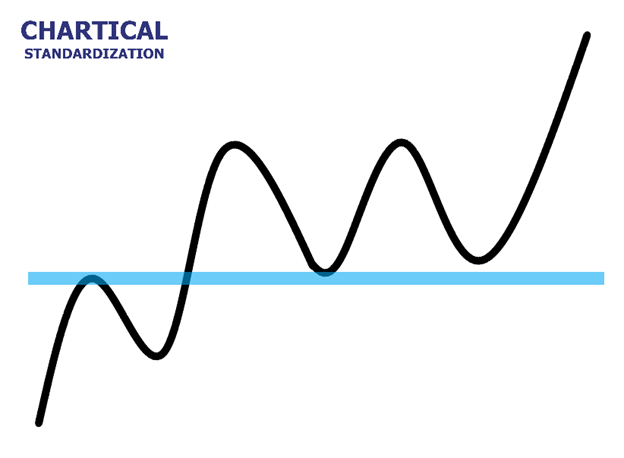
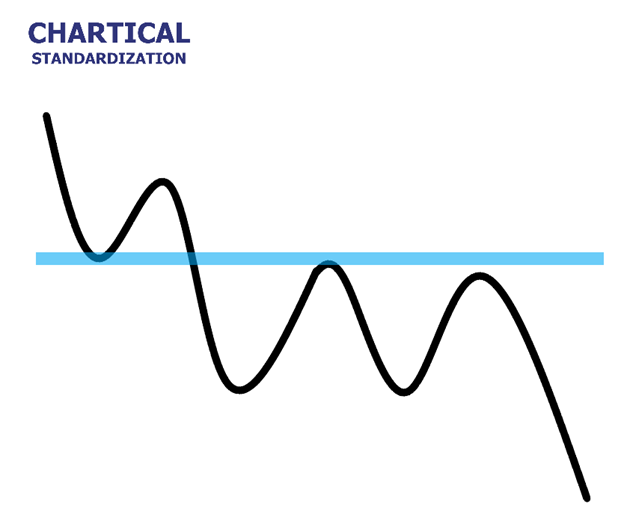
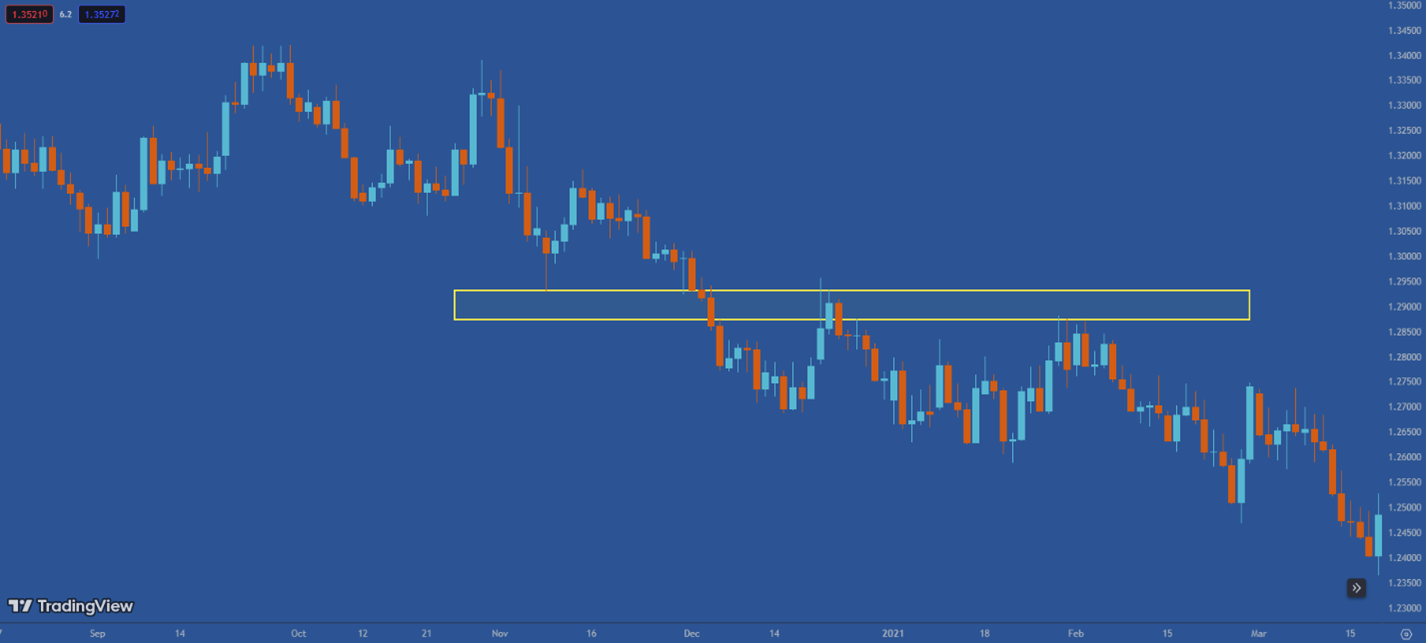
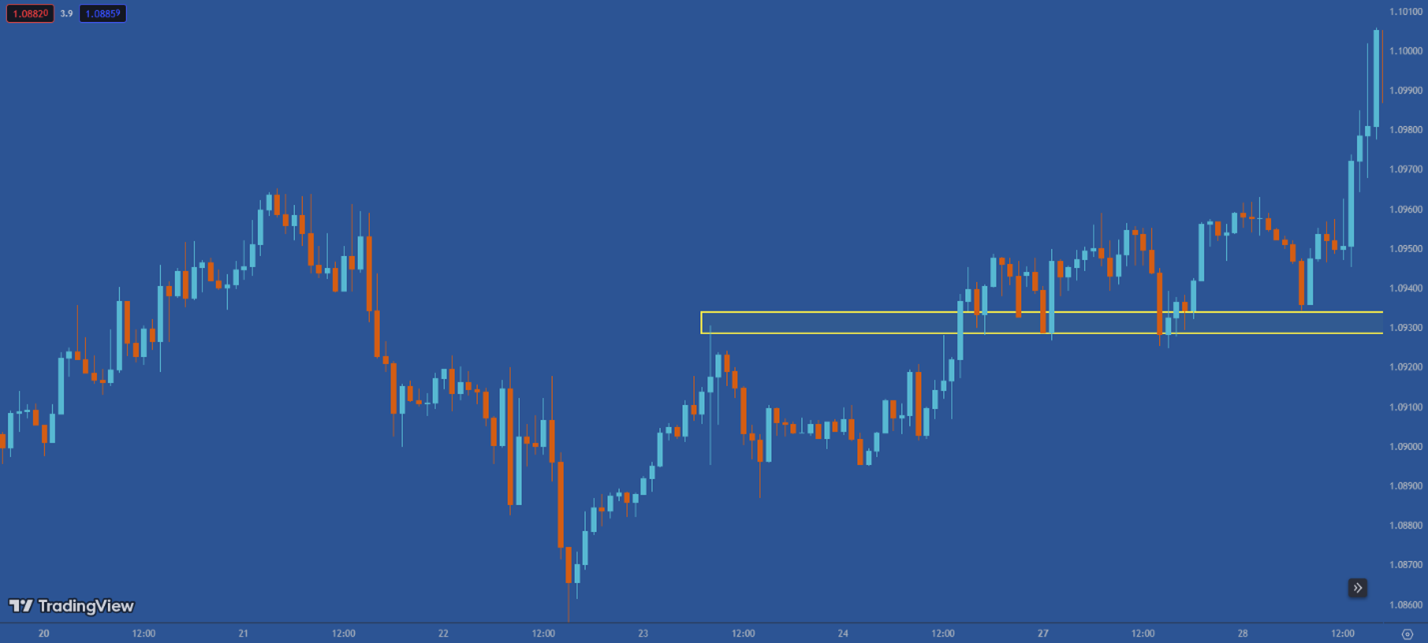
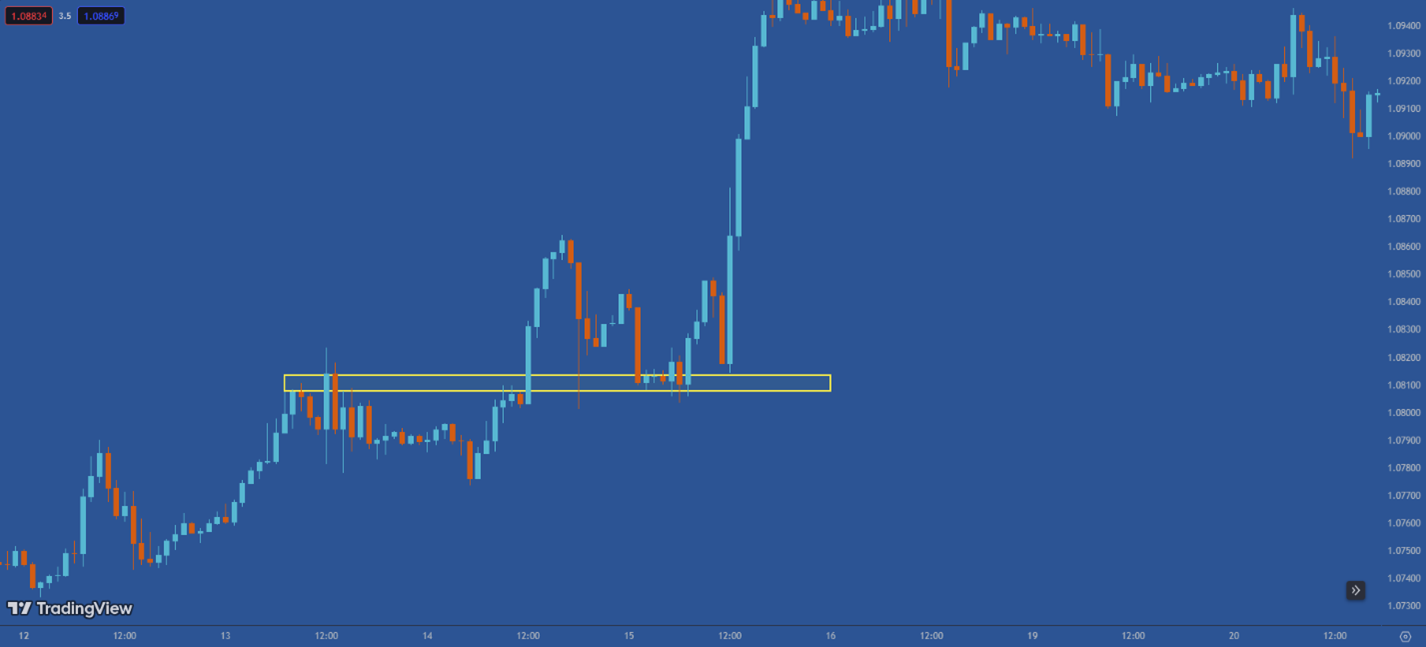
2 - Key Zone – Confirmation
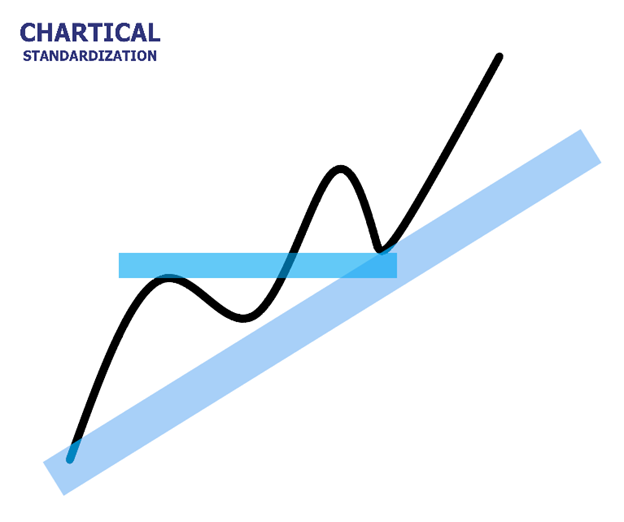
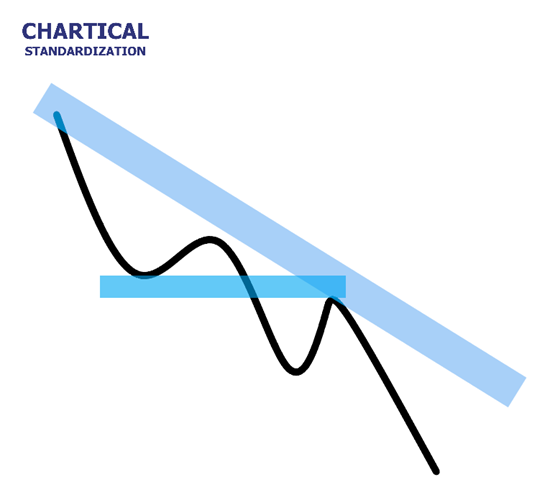
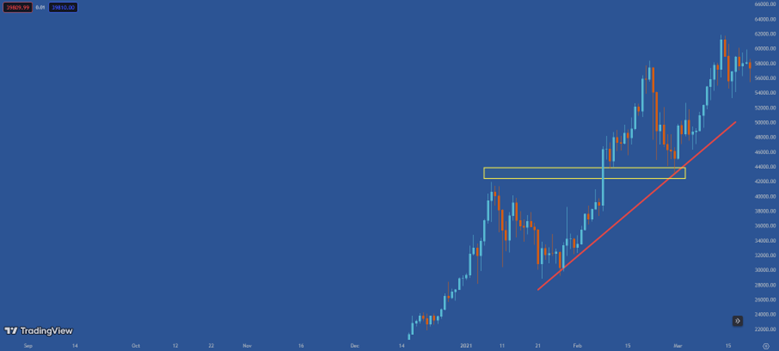
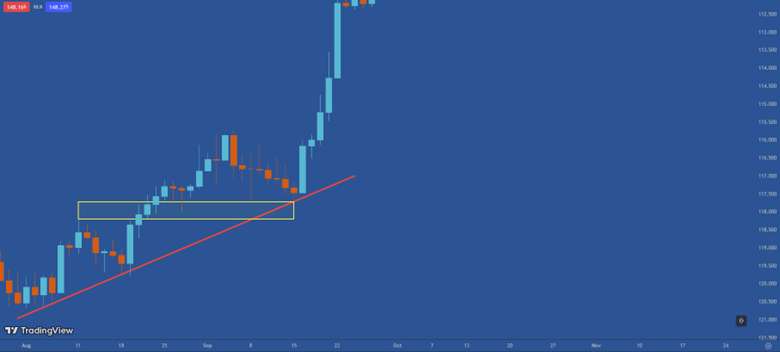
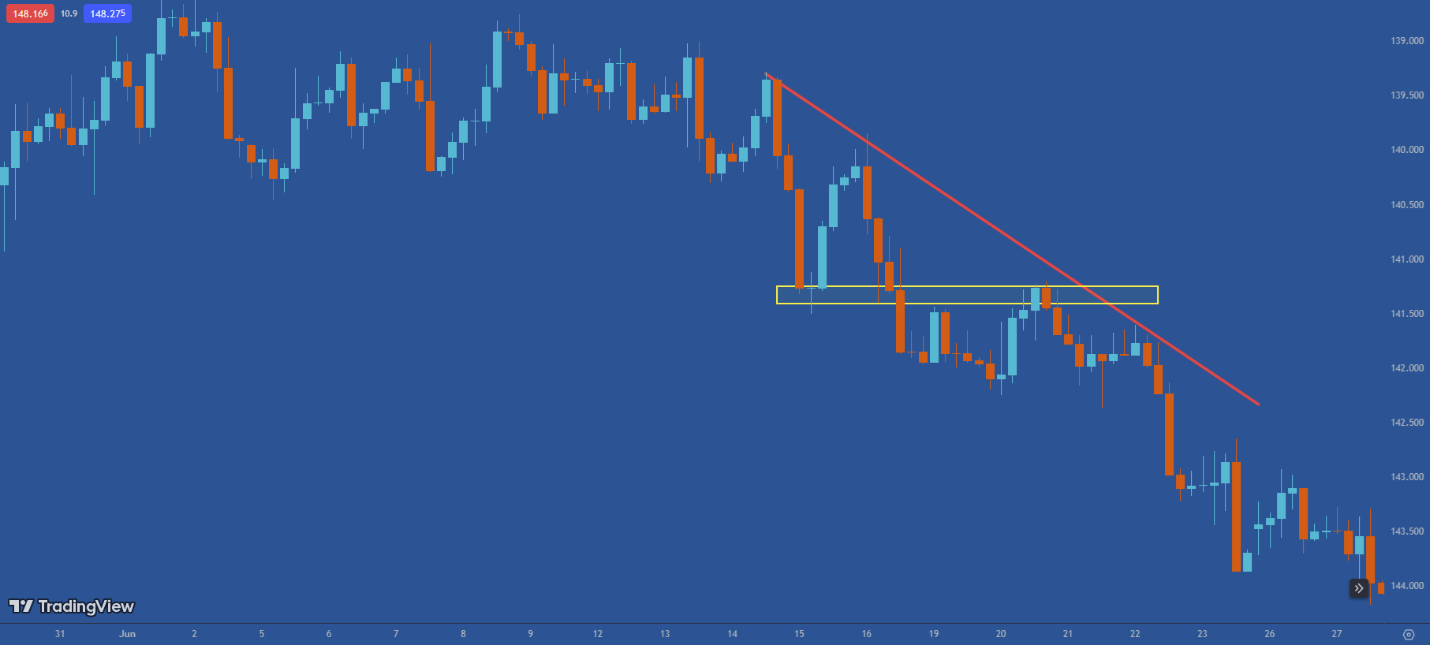
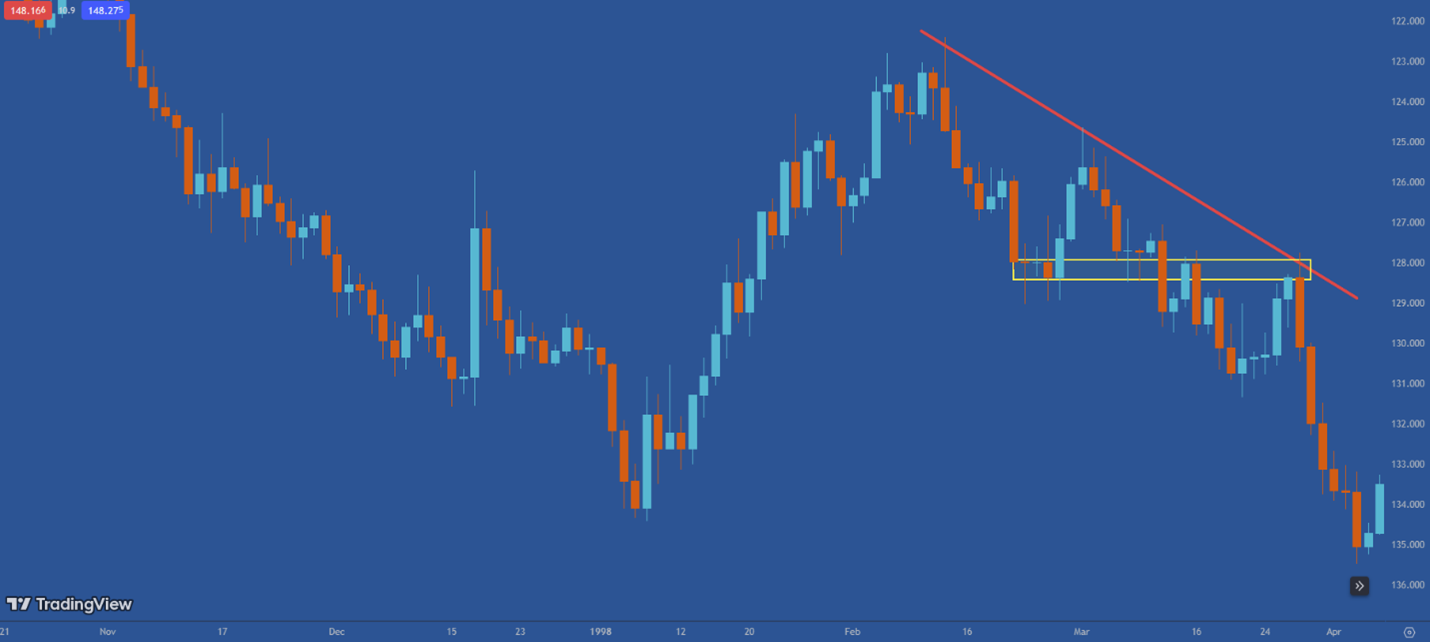
3 - Key Zone – Continue
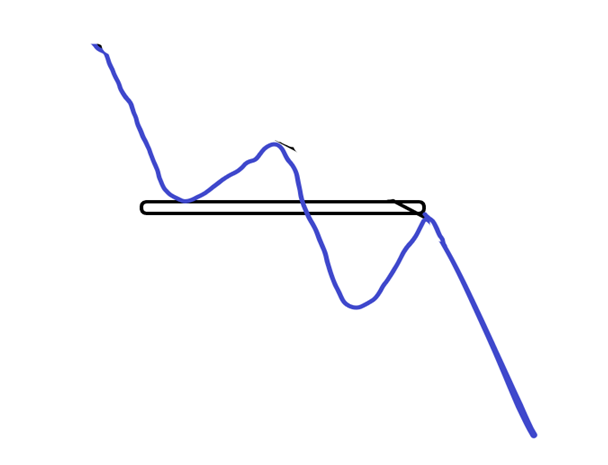
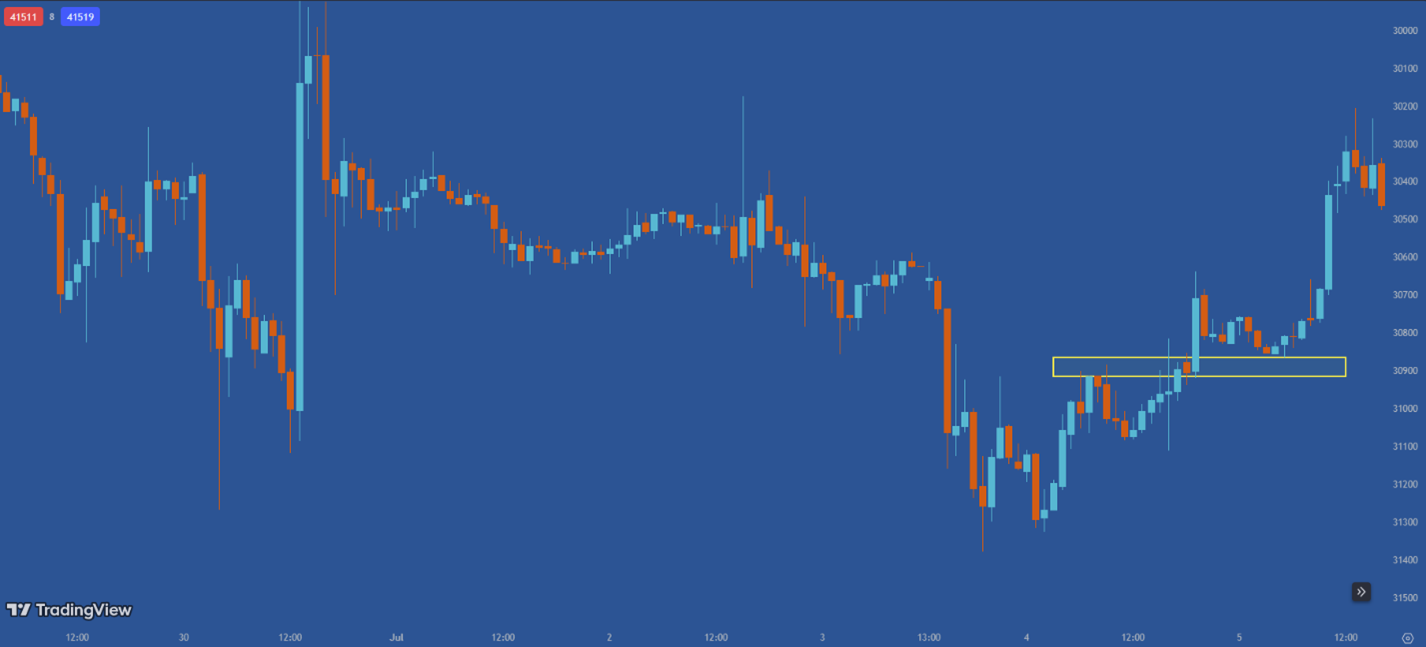
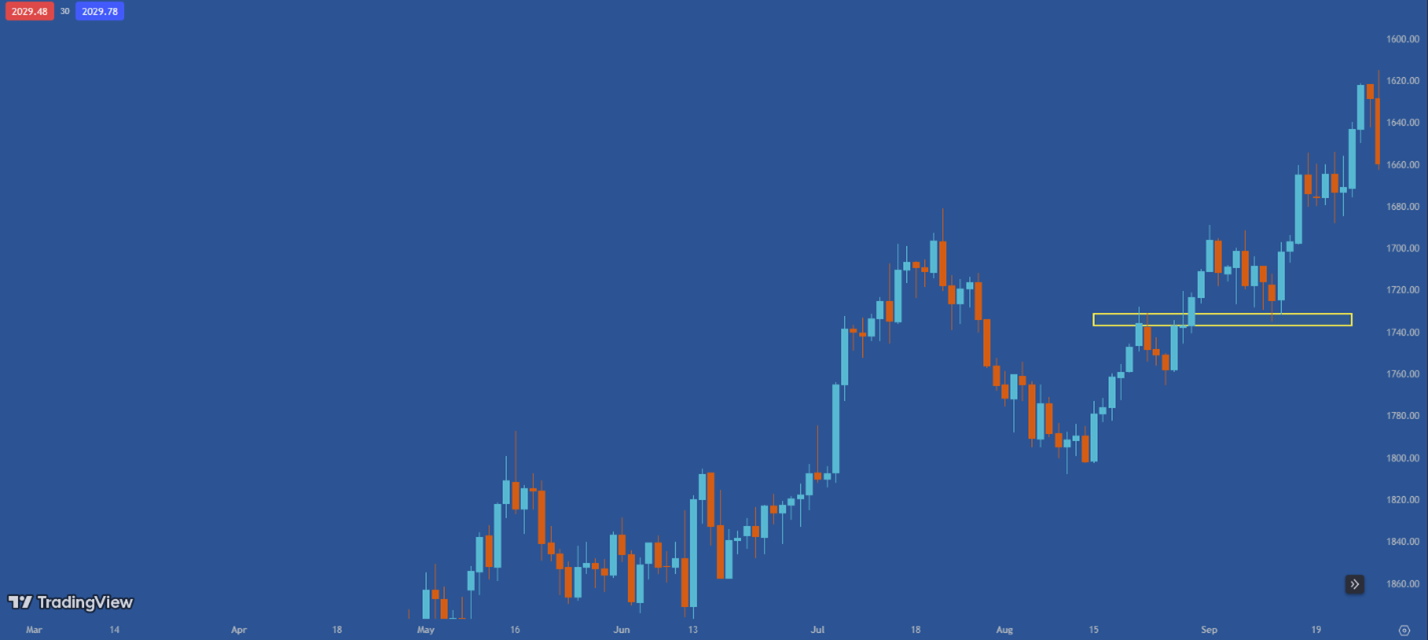
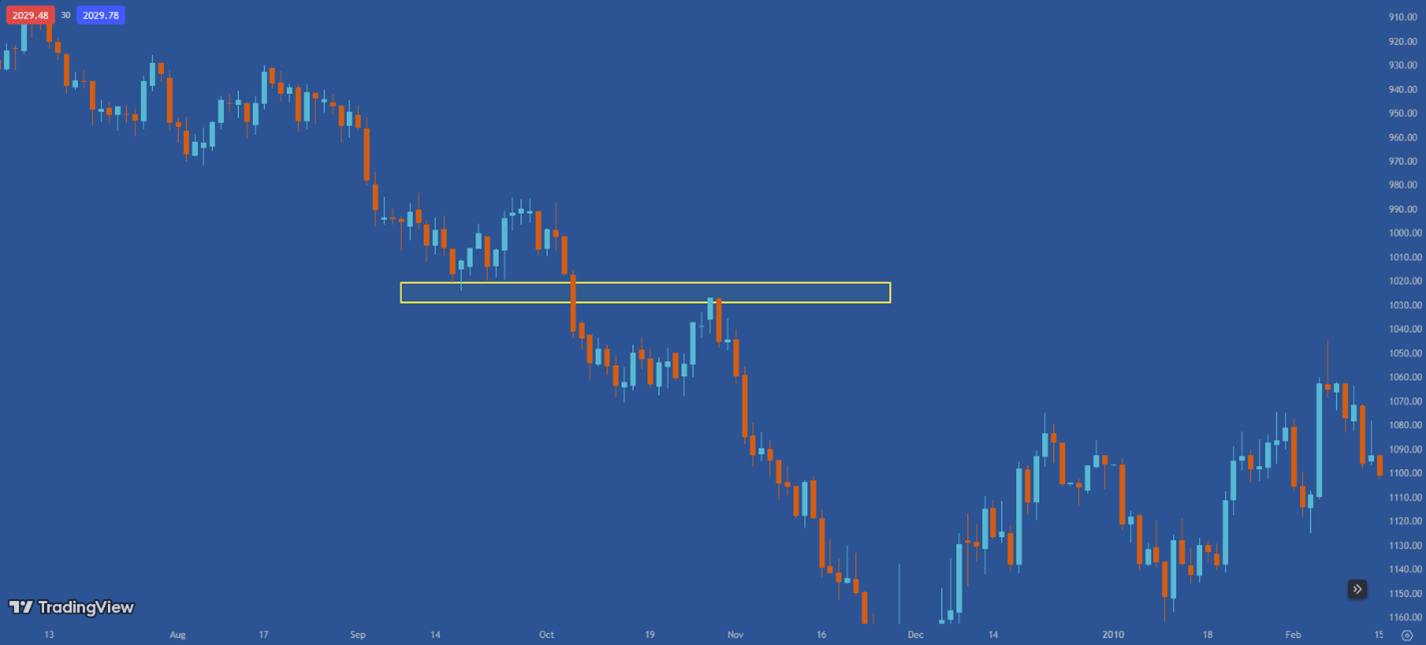
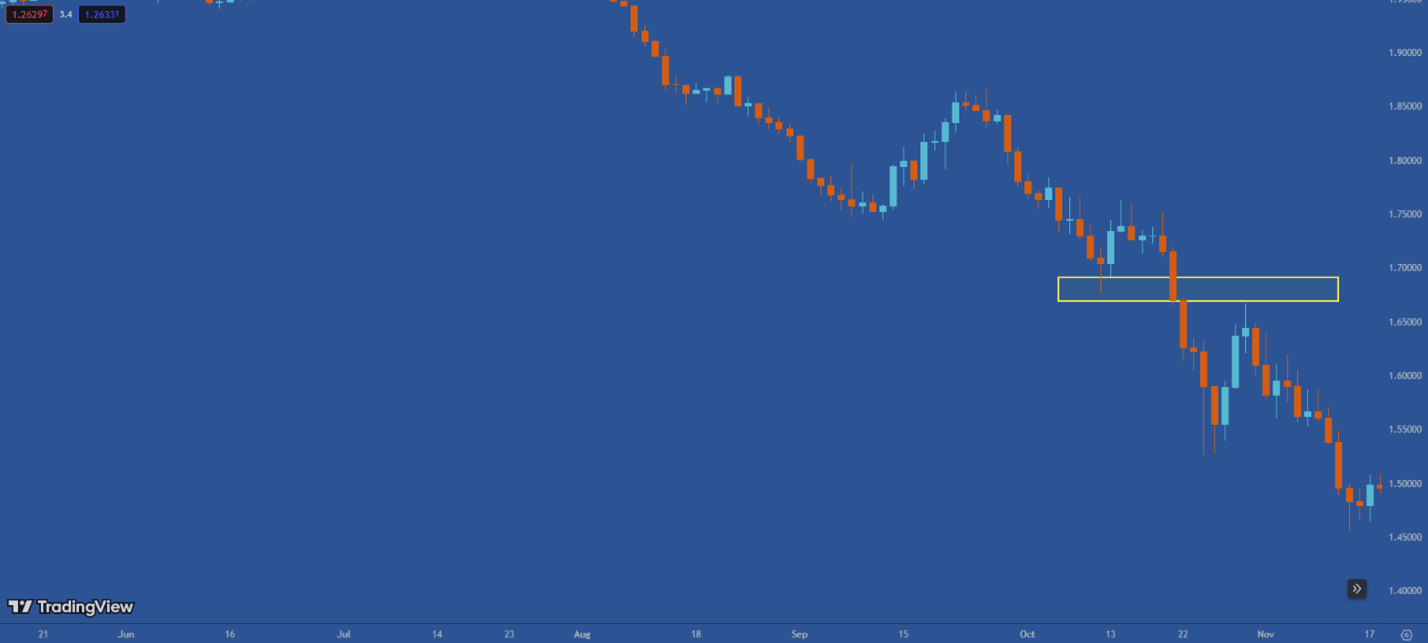
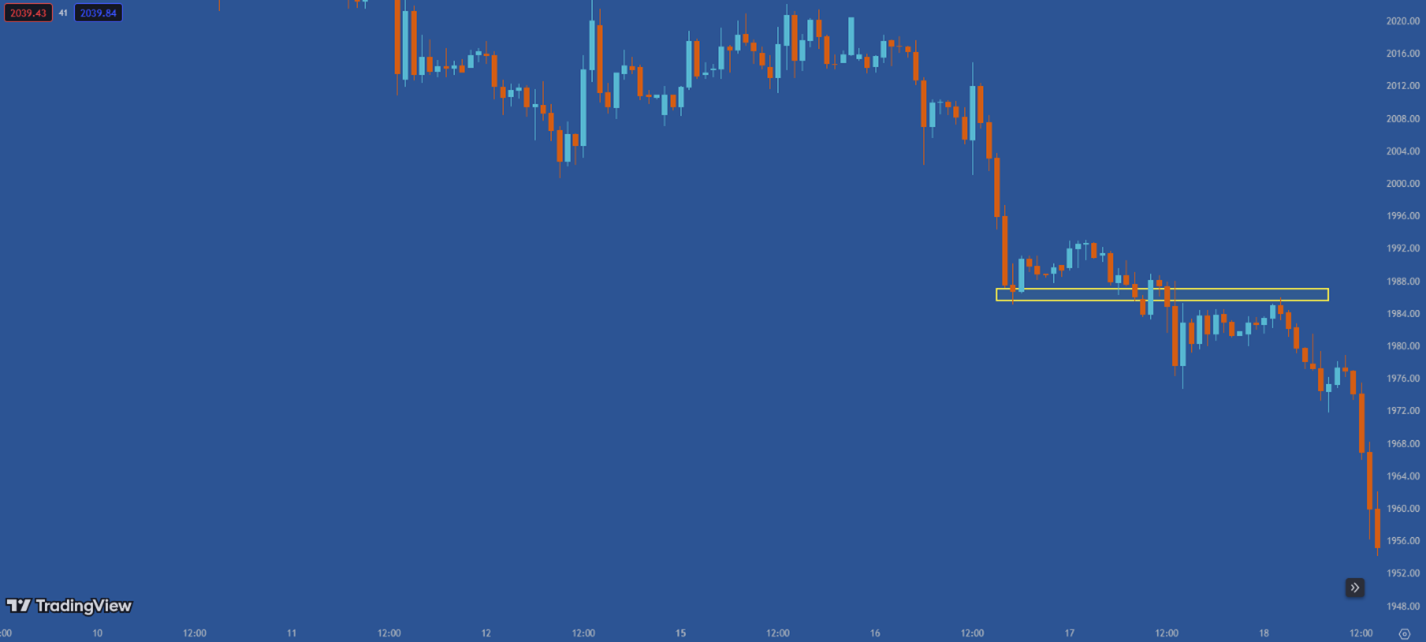
4 - Key Zone – Reset
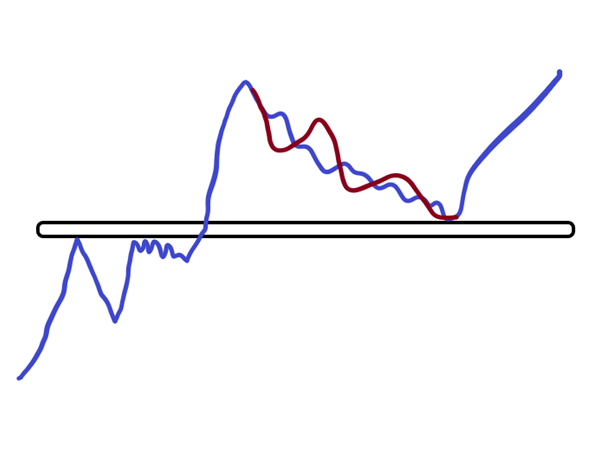
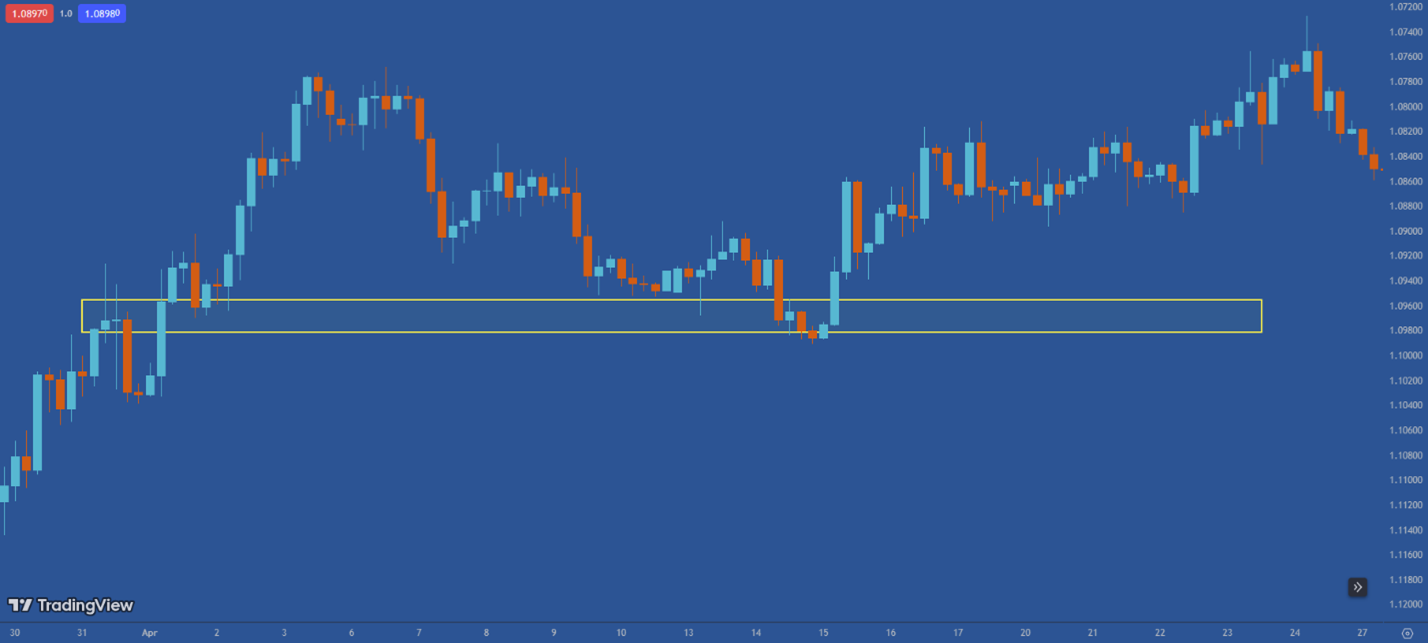
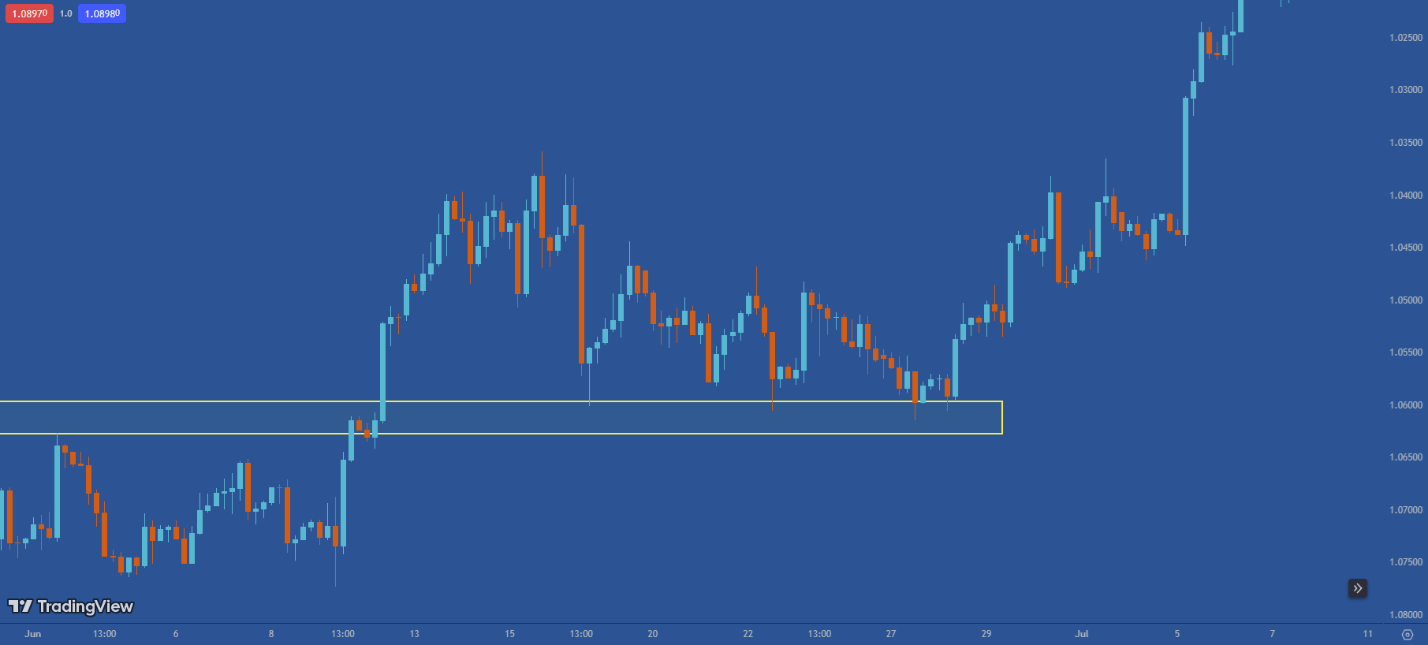
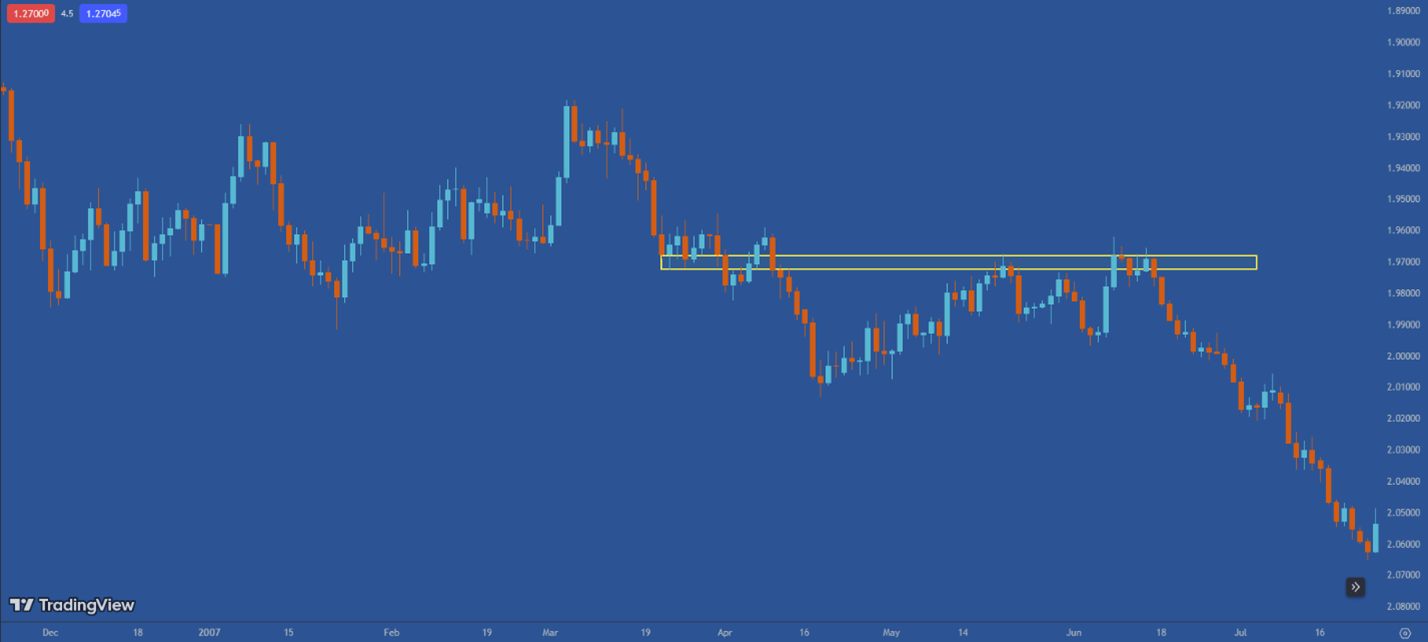
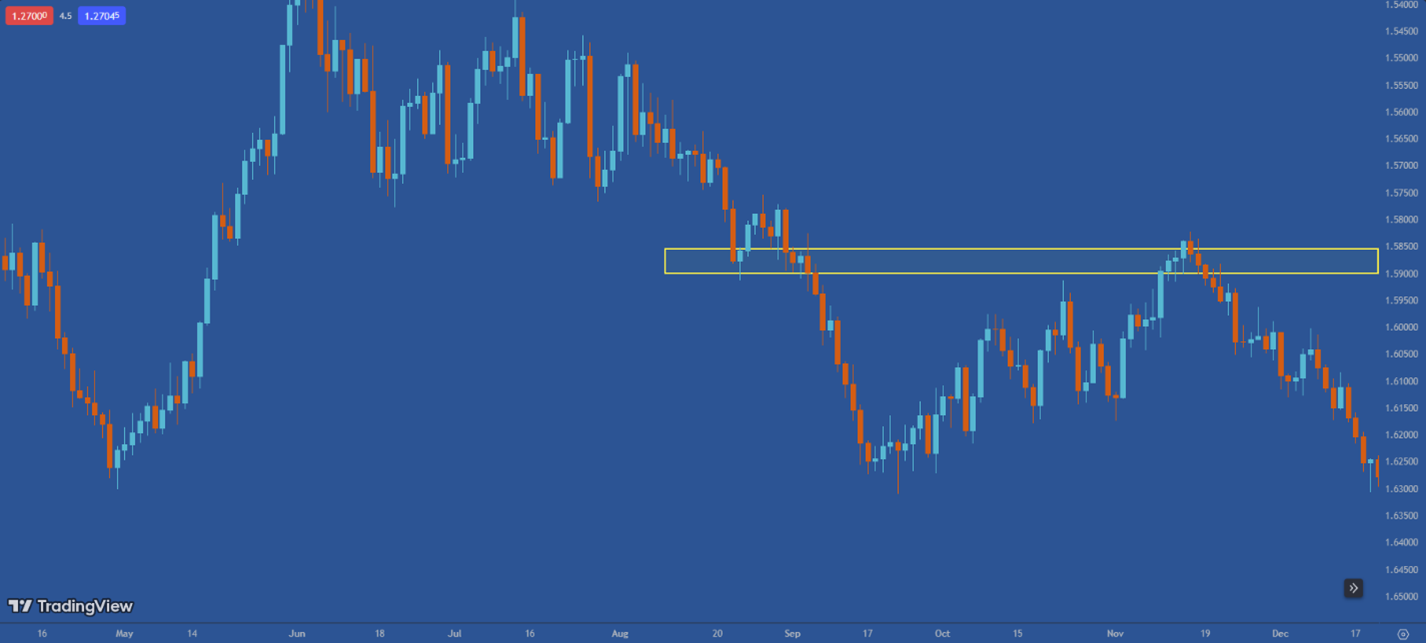
The secret to success:
Remember this from me: we always trade because, not just to...
Final words:
"Entering trades with human logic, exiting trades with mechanical discipline."


