


Chartical 2022
Preface
This book has been written with the intention of guiding traders, both beginners and professionals, toward a deeper understanding of the market and the art of trading. In the current financial world, trading has turned into both an opportunity and a challenge; an opportunity for those who are prepared, and a challenge for those who enter without knowledge or strategy.
The purpose of this book is not to provide quick recipes for getting rich, but to present a structured framework, based on years of study, research, and experience, that can help readers take logical and intelligent steps in their trading journey.
This work seeks to strike a balance between theory and practice: on the one hand, it introduces the fundamental concepts of trading and market dynamics, and on the other hand, it provides practical insights and methods that traders can apply in real conditions.
My hope is that this book will serve as a reliable companion for those who want to shape their future through the financial markets and achieve lasting success.
Introduction
The world of trading is one of the most fascinating and, at the same time, the most complex arenas of human economic activity. Each day, millions of people around the globe engage in financial markets, trying to make sense of price movements, market behavior, and economic signals. Some succeed in this journey, while others lose both their capital and their confidence.
The key difference often lies not in access to information—since today, information is widely available—but in the ability to interpret and use that information effectively. In other words, success in trading requires more than just data; it requires vision, discipline, and a well-founded strategy.
This book has been designed to open a window into the nature of markets, the psychology of trading, and the tools available to analyze and interpret trends. Readers will discover that trading is not mere speculation or gambling, but a profession that demands patience, knowledge, and emotional balance.
By reading this book, you will learn about the foundations of financial markets, the principles of technical and fundamental analysis, and the psychological factors that influence decision-making. You will also see how to avoid common pitfalls and how to build a mindset that supports long-term success.
Chapter One: The Nature of the Market and Trading
Trading has always been an inseparable part of human life. From the earliest days of civilization, people exchanged goods and services to meet their needs. Over time, this simple exchange grew into structured markets, and today it has evolved into one of the most complex systems of human interaction: the financial markets.
But what is the true essence of trading in today’s world? Is it merely buying and selling in hopes of making a profit, or does it reflect a deeper phenomenon? To answer this, we must examine both the opportunities and the challenges of trading as a profession.
The Potentials of Trading as a Career
Trading is one of the few professions where the limit of income is not fixed. Unlike traditional jobs, where salary and progress are often determined by predefined structures, a trader has the chance to achieve significant financial freedom. With the right skills, discipline, and tools, a trader can scale income far beyond conventional expectations.
Another unique advantage of trading is flexibility. A trader is not bound by a specific workplace, office, or even geographic location. With access to global markets through online platforms, one can trade from anywhere in the world—whether at home, in a café, or while traveling. This mobility has made trading especially attractive for those who seek independence and control over their own time.
The Benefits of Trading
- Unlimited Earning Potential – Success in trading is not capped by a fixed salary; it grows in proportion to knowledge, strategy, and discipline.
- Flexibility of Time and Place – Unlike traditional jobs, traders can design their lifestyle and daily schedule around their trading.
- Direct Access to Global Markets – With modern platforms, anyone with internet access can participate in financial markets worldwide.
- Independence – Traders rely on their own decisions, strategies, and skills rather than a manager, company, or organizational structure.
The Disadvantages of Trading
Despite its many attractions, trading also has risks and difficulties that should not be overlooked.
- High Risk of Loss – Without proper knowledge and discipline, traders may quickly lose their capital.
- Psychological Pressure – Constant exposure to market fluctuations can cause stress, anxiety, and even emotional exhaustion.
- Lack of Guaranteed Income – Unlike fixed salaries, trading provides no certainty. A trader may experience both profitable months and losing ones.
- Need for Continuous Learning – Markets are constantly evolving. A trader who fails to keep learning will soon fall behind.
Behavioral Finance and Trading Psychology
Trading is not only about charts and numbers. Human emotions—fear, greed, hope, and hesitation—play a critical role in decision-making. Behavioral finance studies the psychological factors that influence traders, and understanding these elements can often be the difference between success and failure.
A professional trader learns to control emotions, avoid impulsive decisions, and follow a predefined strategy. In contrast, amateur traders often fall into emotional traps, such as holding on to losing trades due to hope, or selling too early because of fear.
Passion, Not Just Need
Many people enter trading with the sole motivation of making money. While financial gain is a natural goal, true success usually belongs to those who are genuinely passionate about the art of trading. Passion drives patience, commitment, and the willingness to endure hardships. Without passion, trading can feel like a burden and often ends in disappointment.
Required Capital
Another essential question for beginners is: How much capital do I need to start trading? The answer varies depending on the market and trading style, but one principle is universal: only risk the money you can afford to lose. Trading with borrowed money or essential funds (such as living expenses) is a recipe for disaster. A trader should consider capital as a tool for growth, not as guaranteed profit.
Money or Capital?
There is an important distinction between money and capital. Money, in its simplest form, is what we use for daily expenses. Capital, however, is money intentionally set aside for investment or business. Treating your trading account as “capital” rather than “money” changes your perspective—you will respect it as a resource to be managed strategically, not spent impulsively.
Trading is Not Gambling
One of the most common misconceptions is equating trading with gambling. While both involve risk, the difference is profound. Gambling relies on chance, whereas trading, when done properly, is based on analysis, strategy, and probability management. A disciplined trader has far greater control over outcomes than a gambler.
Price is the number upon which the buyer and the seller agree as the value of an asset. In other words, both parties reach a mutual understanding that the asset will be exchanged at a specific figure considered its value. This figure is introduced as the price.
Therefore, every trade consists of two events: one purchase and one sale. Without both sides—a seller and a buyer—no transaction can take place. For example, if I am willing to buy your car and even offer to pay more than its actual value, but you refuse to sell, no transaction has occurred. Even if I price your car at one hundred thousand dollars, the car’s price is not truly one hundred thousand dollars until a transaction is made and you agree to transfer ownership in exchange for that amount.
The reverse is also true. If a buyer is willing to purchase an automobile below its actual market value—for instance, offering sixty thousand dollars for a car valued at seventy thousand—the car’s price is not sixty thousand dollars, since the owner will not agree to sell at that figure.
From this, we understand that although buyers and sellers may present their proposed numbers for a commodity, these numbers do not define the price until a transaction occurs. A price is only established when both parties accept the terms of the exchange (the type of asset and its price).
Last Best Price
Consider the following table: as shown, in all financial markets, no transaction occurs unless a buyer and a seller face each other and reach an agreement. The table that reflects this process is called the Last Best Price. At the top of this table, the best prices waiting in line are displayed. (See the next page for the table.)
The Order Queue
In financial markets, there is a trading core where all traders’ orders are lined up in sequence, waiting to be activated. But how is this order determined?
Orders are prioritized according to the best prices. For example, in the upper part of the table—which shows the sellers’ offers—the sequence begins with the lowest price at the top, followed by progressively higher prices. In other words, the more favorable numbers (cheaper prices for buyers) are placed at the head of the line. As we move down the list, we encounter more expensive, less favorable numbers.
Why is this the case? Because naturally, sellers want to sell at the highest possible price, while buyers always seek to purchase at the lowest possible price. Therefore, the most favorable numbers for completing a trade are the cheaper ones, which take priority in the order queue.
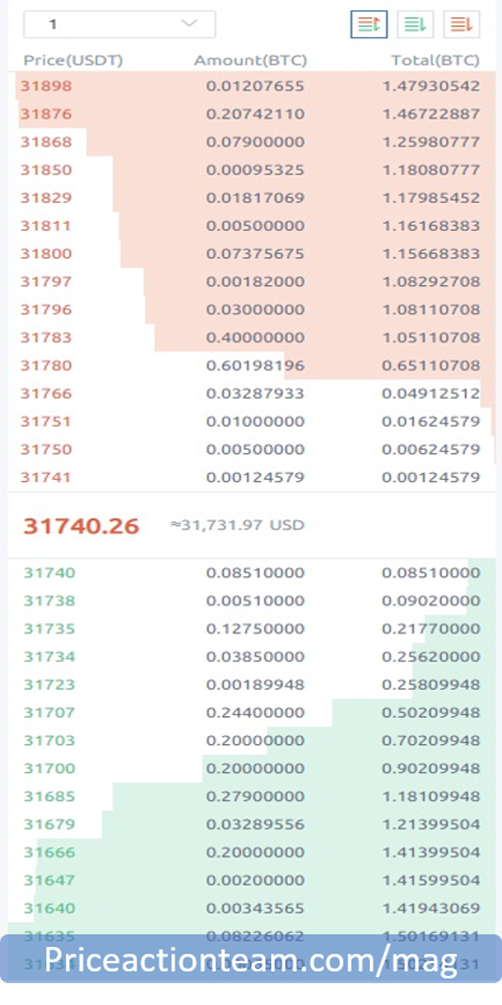
For Buyers as Well
It works the same way for buyers. Look at the green section of the table above. Every buyer wants to make their purchase at lower prices. From the sellers’ perspective, the “better” number is the highest bid price, because a seller wants to sell their asset at a higher price. This is shown in the lower section of the sellers’ table, which displays the prices sellers are offering. In the buyers’ list, we also see the highest price at the top, representing the most expensive offer. As we go down the rows, we observe that cheaper prices—meaning worse prices from the traders’ perspective—are placed further down.
Converting Price into Market Movement
We understand that the market mechanism works such that, behind the trading core, in the “last best prices,” prices are arranged from better to worse. Whenever the best sell price meets the best buy price, a trade occurs. The price at which this new trade happens becomes the last price on which a candlestick is built. When the volume at a particular price is exhausted—for example, when 100 units have been bought and sold entirely—the price moves up. This is the point at which an upward candlestick forms, or the current candlestick creates an upper shadow and a bullish move occurs.
Market Depth
The more traders there are sending buy and sell orders to the market, the smoother the price moves, and the easier it is to analyze trader behavior. A market with many participants submitting orders of different volumes at various prices is called a “deep market.” One advantage of this depth is that there are no price gaps. In other words, one reason for price gaps is the absence of orders at certain prices, causing the price to move quickly through those levels.
Some points to consider:
- In the “last best prices,” which are the queues waiting for order execution, only traders and their orders are considered; there is no concept of timeframes in the trading core. It doesn’t matter to the core whether thousands or millions of traders use different timeframes. The trading core only receives the order, sees the price, and places it in the appropriate position in the queue.
- The trading core does not pay attention to any method or tool used by the trader, whether it’s Chartical Jabal Ameli, indicators, or the trader’s analysis. It only considers the volume of buy or sell orders submitted at specific prices and places them in the core.
When the price moves, if the volume at a higher price is fully executed, the price moves upward; conversely, if the volume at a lower price is fully executed, the price moves downward.
So, in the real world, what matters to the trading core is the process of executing orders from thousands or millions of traders—not timeframes, tools, or traders’ analysis. The only important factor is the volume and price levels of the orders, which then determine how buying and selling occur. In the Chartical Jabal Ameli method, the trader should focus on the price itself.
The Nature of the Market
Imagine driving on a road when a deer suddenly crosses in front of you. Should we be upset that the deer is in the road and forces us to slow down or stop? No—humans built roads through animal habitats. The deer is just where it naturally lives; we are the ones who built the road through its environment.
Looking at candlesticks through the lens of candlestick patterns, indicators, or oscillators is similar. Price is like the deer—it is exactly where the trading occurs, not at some percentage or value on an indicator. By observing the price directly, without any intermediaries or shadows, we gain clues about what is happening in the market, giving us at least a step ahead of other traders.
Efficient Markets
One reason we can take advantage of opportunities in financial markets is that we operate in efficient markets. According to Eugene Fama, Nobel laureate in Economics 2013, an efficient market is one with so many participants and so many high-volume trades that the influence of any individual or small group on price changes is minimized—possibly even zero. Moreover, information and news should be released simultaneously and equally so no one can exploit it in advance.
In the Chartical Jabal Ameli method, clues provided by an efficient market allow the trader to quickly determine the direction of price movements. News acts as a catalyst, accelerating price movement in the trader’s favor. Because information is released evenly and traders react quickly, no one can exploit news unfairly.
In efficient markets, price is like a mirror of all underlying events. Observing price directly lets us see the reasons why traders made decisions or changed behavior. This real-time insight is faster and more accurate than relying on indicators or patterns, which often result in delayed reactions and losses.
Random Sequences
Previously, we discussed that in the Chartical method, information is not news or statistics—it is the clues and techniques that help traders understand the flow of orders and liquidity in the market. The goal is to know who is in the market (institutional, professional, or retail traders), their direction, and how long they will stay.
Random sequences refer to situations where similar events occur repeatedly but without a logical reason. For example, flipping coins repeatedly among a thousand people may produce patterns that appear meaningful, but they are purely coincidental. In markets, it is essential to determine whether the techniques we use have a solid scientific and practical basis or are the result of random chance.
Impact of News on Gold (Spot)
Consider the gold spot market. During economic uncertainty, large investors buy gold as a safe haven to protect wealth. The effect of news—such as a China-US trade war, localized floods, or a global pandemic—affects traders differently depending on its scale. Thus, expecting traders to always behave as they did in the past is unrealistic.
Difference Between Traders and Analysts
In trading, you may notice that some people produce excellent analyses but achieve little profit, while others with poor analytical skills may profit greatly. Analysts often justify price behavior with charts, patterns, or scenarios, primarily creating content. Traders, on the other hand, seek high-probability opportunities and focus on entering and managing trades effectively..
Chapter Two: Basic Concepts
According to what has been said, analysis in classical finance falls under a traditional category. In this approach, the individual seeks to justify price movements. While past market movements can easily be explained, how to use that information to determine the current flow of money in the market, which direction it is moving, and how long that money will stay in the market—so the trader can profit from it—is not clear.
Behavioral Finance
In behavioral finance, as defined by modern economic science, the focus of the trader is on the current state of the market and how price changes are occurring—specifically, when liquidity flows are created. Traders who can detect the creation or changes in current money flows in the market no longer need to analyze the market itself; instead, they only need techniques.
In essence, those using classical finance can, at best, create attractive content for social media. However, traders aim to make money from markets, not content. Therefore, one must work with a reliable method that allows trading with any amount of capital and on any timeframe to achieve significant profits. Otherwise, the individual may soon need to change careers.
The difference between analysis and trading is a scientific and highly general issue that has nothing to do with talent, literacy, or skill. Individuals themselves choose whether to be analysts or traders. It is important to note that in the Chartical Jabal Ameli method, no existing type of financial market analysis is rejected. Rather, these methods are excellent for analysis and content creation—but not for making trading decisions that result in buying, selling, or exiting trades.
How Price Action Works in Chartical Jabal Ameli
Until relatively recently, the only knowledge available for trading in financial markets was classical finance. Traders could only rely on analytical methods. Gradually, they realized that even without patterns, indicators, or other existing methods, they could understand price movements. Over time, some individuals abandoned these patterns and indicators.
For the first time in the world, Richard Wyckoff introduced price action based on principles of economics and social sciences. Following that, this knowledge expanded, and more theories were developed.
The U.S. Economic Crisis
During the 2007–2008 financial crisis in the U.S., top economists and analysts gathered to find ways to predict the crisis in advance to prevent losses or even benefit from it. After extensive research, they found that the only effective method was price action. From that time, price action became increasingly popular and scientifically developed among traders.
Interestingly, real price action is based on principles of economics and social sciences. Therefore, real price action does not use any tools, indicators, oscillators, patterns, or even candlestick patterns. Even “price action patterns” have no defined role in real price action, as it focuses solely on traders’ behaviors in the market, without any bias.
From this explanation, it can be inferred that if a method combines tools with price action, it is not real price action, because genuine price action is based entirely on economic and social sciences and deals only with price and its movements. The only thing a trader needs to examine is the price itself.
Chartical Jabal Ameli System
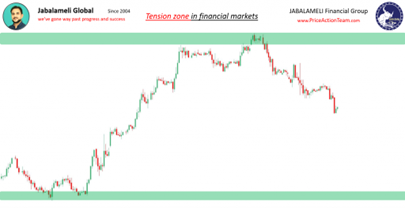
In the previous section, we discussed tension levels, why they occur, and why they are important. In this section, we will focus on identifying important and influential swings.
From this point forward, all points mentioned should be treated like pieces of a puzzle. They must be preserved and combined when entering the market to ensure a successful trade.
All the techniques presented in this chapter should eventually be combined in the trading checklist at the end of this book, forming the ultimate picture—earning profit from trades.
Swing or Tension Level
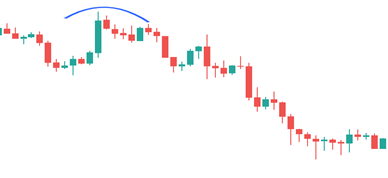
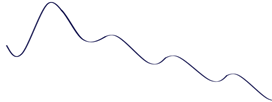
The terms “swing” and “tension level” are equivalent, so we will no longer use both simultaneously. A swing in markets refers to a point where the price changes direction—that is, the price rotates. For example, as shown in the figure below, we have an effective swing: here, the price direction has changed. Before this, the price was moving upward; afterward, it started moving downward.
Pay attention to the next figure. As marked by the red line, there are several swings in this chart. These swings occur because the price was initially moving upward, then changed direction downward, moved upward again, and finally changed direction downward once more.
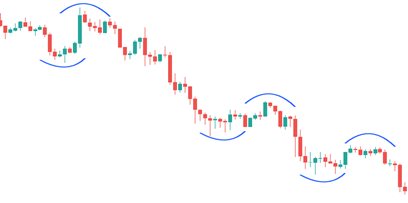
We understand that any part of the market where the price pulls back and then reverses is called a swing. To identify it, we do not use any specific tools such as technical methods, fractals, or indicators. Instead, we simply observe with our eyes and consider any area where the price has reversed as a tension level.
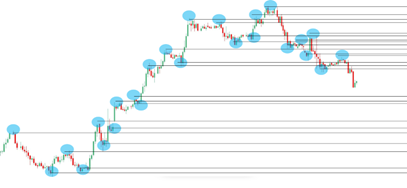
As seen in the figure above, if we were to plot all tension levels on the chart, it would no longer serve as a trading tool or platform. Instead, it would become like a musical instrument—such as a guitar—that is meant to be played. Amid the cluttered chart, the trader can no longer see what truly matters.
In this context, there is a principle called Troxler’s effect, which comes from the psychology of trading. It states that when we focus excessively on something or search for it too much, our senses become overwhelmed with information, and eventually, we fail to notice what is truly important. Therefore, we only consider effective swings on the chart.
Effective Swing
An effective swing is a swing after which a significant amount of money has entered the market, resulting in notable changes in price movement. For example, in the figure, immediately after the swing, the price reversed and moved upward effectively—making it an effective swing. Similarly, the next swing is also effective because it led to a meaningful movement in price afterward.
In the market, there are also ineffective swings. For example, as seen in the figure, this is not considered a swing because, after it, a significant amount of money did not enter the market.
Based on the concepts discussed earlier and the market book, we understand that all trades occur at the market core. Regardless of indicators, analytical methods, or timeframes, orders line up in a queue, and sequentially, each price level is processed until its volume is exhausted before moving to the next price.
When a price movement cannot continue, it means that there was insufficient buying volume and transaction activity, and no effective money was behind that swing. Therefore, when the price moved upward but stopped immediately, it indicates a neutral movement.
Hence, we only consider swings after which a significant amount of money has entered the market.
Why don’t we draw the swing and only consider it? Because in trading, you don’t need to draw anything. It is enough to identify the swing based on the last few candles you see on the chart—approximately the last twenty candles.
Note that it is only after the last swing that the price begins its effective decline. Therefore, an effective swing is considered a swing in which there is a sufficient amount of money, and the market and its traders demonstrate a meaningful movement.
Sometimes, there are shadows in the market that raise the question for traders: should we consider the swing including the shadow or excluding it? For example, in the figure, you can see several effective swings, but what role do the shadows play in these swings?
Many times in the markets, due to various reasons—such as the release of news related to a symbol, or political, military, social events—we observe large shadows. These shadows can be so large that they are inconsistent with the size of other shadows in the market context. As mentioned before, what the trader sees in the market context is important, not the past of the market. Therefore, if a candle is unusually larger than the average size of other candles in the market context, it can be inferred that it was created by the “frogs.”
A Persian proverb says: “When a city has no sheriff, the frogs become gunmen.” The same principle applies in trading markets: when large traders are absent, small traders become influential.
If you drop a single drop of ink into a full swimming pool, how much impact does it have compared to dropping the same drop into a glass of water? In the trading markets, it works similarly: the ink drop represents the influence of small traders, while the glass or pool represents the presence or absence of sufficient large traders. So when large traders are absent, the trades of small traders affect the market. Once their money runs out or false excitement dissipates, the large traders return to the market, and that movement becomes a shadow—all those moves and trades reverse, leaving nothing behind except the shadow.
This is why such shadows should not be considered. Shadows should be conventional and proportional to the average size of candles in the market context. That is, if you see an unconventional shadow that significantly differs from other candles, it should be ignored.
Drawing Swings
At the beginning, it might be necessary to draw these tension zones a few times until you can observe them visually in the market context without the need for drawing. This will allow you to monitor price reactions in these areas and train your eyes and mind.
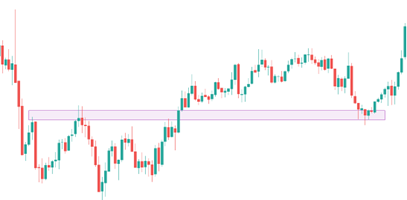
To draw these zones, simply mark the region with the highest candle overlap and engagement, where the market has rotated, but use the minimum possible thickness, as shown in the figure below.
As seen in the figure, neither the thickness nor the height of the box matters. The goal is simply to indicate that there is a zone of tension and engagement between traders, which ultimately led to a price reversal. We need to monitor this area so that when the price reaches it again, we can observe traders’ reactions. The conditions for breaking these levels will be discussed in later chapters.
Note: You do not need to draw all levels. Only the effective swings, and among them, just the nearest ones are required. The levels drawn in this figure are for instructional purposes only.
Static and Dynamic Zones
In the Chartical Jabal Ameli method, static and dynamic levels are the same as tension levels, which we call key zones.
Static and Dynamic Key Levels
As mentioned earlier, every group of traders is part of a trading community. When their community collectively faces tension, their options become limited, and the probability of predicting their future behavior increases significantly. According to the figure, zones on the chart that lie on a flat level are called static key levels.
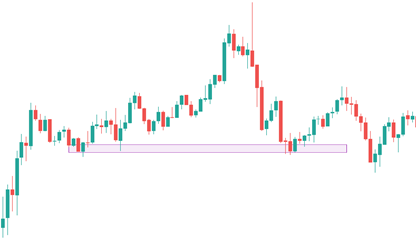
In the Chartical Jabal Ameli method, the way a trader uses these two types of zones—static or dynamic—makes no difference. The trading rules for static and dynamic zones are not different, and both arise for the same reason.
An important point is that, as shown in the figure, when we draw these zones, we are not looking for support, resistance, channels, or trend lines. Instead, we aim to identify the zones that traders react to with high probability, because if support and resistance truly existed in the market, the price could not continuously move above or below a certain level.
According to Eugene Fama’s definitions, terms like support, resistance, trend lines, and channels are just explanations for price movements. For example, the price rises and reacts at a certain level, and elsewhere it hits another level and reverses. Some traders assume this happens because it is a support, resistance, or channel. However, in the Chartical Jabal Ameli method, the key question is: are these zones truly significant? That is, were they formed not randomly, and if they are significant, what reaction should we expect when the price reaches them?
Golden Levels
Golden levels are similar to static or dynamic levels, but with a phase change. For example, if we see a level in the market that previously caused a downward reaction and pushed the price down, and now the price breaks that level upward, the zone becomes highly attractive to the price. If the price reaches this zone, we can expect a reverse reaction—this time causing the price to rise. This is what we call a golden level, and the price then moves upward with a strong movement or steady, regular candles, but now in an upward direction.
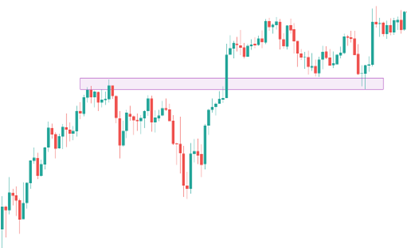
For downward movements, it works in the same way. Before the price reaches the level, it has been rising, but after the breakout—when the price returns to that zone—the price direction changes. Unlike before, the price now enters a downward phase and moves lower.
An important aspect of this phase change, or golden levels, is harmony. As shown in the figure, if the market creates a phase change (golden level), the timing—both before and after the phase change—as well as the price movement in terms of pips or points, should be very close to each other, showing a harmonious phase change on the chart. The distance between them should not be too large.
For dynamic golden levels, just like static or dynamic levels, we observe a market reaction. According to the figure, the price first declined, but after breaking that level and returning to that zone, it shows upward behavior. Here too, as with static levels, price harmony is extremely important for the trader.
We have learned that zones on the chart that are horizontal are called key static levels. If these zones are slanted or diagonal, they are called key dynamic levels. We also learned that if the price breaks a zone, whether static or dynamic, and then returns to that zone, we expect a reversal movement, and these are called golden levels.
The main condition for a valid golden level is the maintenance of harmony within that zone.
If this phase change forms a “elephant and cup” shape, this level is not suitable, because when it forms this shape, it loses its optimality. As you can see in the image, before the phase change, the previous correction and phase change were smaller, but after it, they become larger. Therefore, it is no longer optimal.
In the next sections, we will discuss “Depth” (Deps). Whenever depth is increasing, it means that traders moving in the direction of the trend are weakening. One of the reasons why harmony must be maintained is this issue. Of course, there are other reasons as well. Ultimately, the weight of the order flow in the buying or selling direction changes in a way that it is no longer profitable for the trader to operate in that direction, so we should not trade in that position.
When we want to trade in the financial markets, whether it is a buy or sell trade, there are two situations: the current price is either below or above our expected level. For each situation, we must send the appropriate type of order to the market so that the trade is executed correctly.
First, we will examine the orders that lead to buy trades.
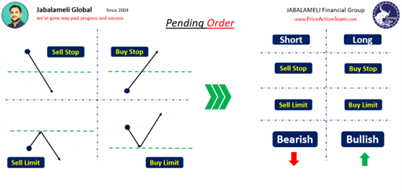
Buy Stop and Buy Limit Orders
In financial markets, we can execute buy trades in two ways: using a Buy Stop order or a Buy Limit order. Each of these must be used in its proper context.
Buy Stop
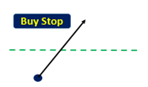
When the price is below the level at which we intend to enter a buy trade, and we decide that in the future, when the price rises, we want to open a new buy trade, this is called a Buy Stop.
Trading with a Buy Stop order works as follows: the trader instructs their broker, via the trading platform, to execute a buy trade when the price reaches the desired level. The broker executes this order regardless of the timeframe the trader is observing or the reason behind the decision.
For example, if the current price of a stock is $1000, and for any reason, you believe that if the price surpasses $1100, it could accelerate further upward, you can set a Buy Stop order at $1100 with a specified volume. When the price reaches $1100, the broker executes the buy order at that volume.
An important point is that in such conditional orders, your trade will not be activated until the price reaches the specified level. Placing the order does not mean you have entered the market yet. Additionally, when the price reaches the desired level, you do not need to be in front of the computer. You can set an order, and even if you are offline for several days, it will be automatically executed when the price hits the target. From that point onward, market fluctuations will affect your profit and loss, but before that, your account remains unaffected.
Another interesting point is that you can cancel your order at any time before it is triggered.
This describes how a Buy Stop works; however, trading with a Buy Limit order is slightly different.
Buy Limit
A Buy Limit order is used in the opposite situation. Here, the current market price is higher than the level at which the trader intends to buy. In the previous scenario, the trader believes that if the price rises to a certain level above the current price, it will continue to go higher, so they place a Buy Stop to follow the upward momentum.
In contrast, a Buy Limit order is used when the trader expects the price to fall to a lower level first and then reverse upward.
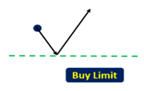
Buy Limit
In contrast, a Buy Limit order works the other way around. Based on the trader’s data and analysis, regardless of the timeframe they are observing, they want to buy if the price drops below the current market price and reaches a specific level. This is because the trader assumes that the price will not go lower than this level, making it the lowest possible price in the market, and allows them to execute a buy trade at the most favorable price.
For example, if the current price is $1000 and the trader believes that in case of a decline, the price will not fall below $800, they can set a Buy Limit order at $800 with a specified volume. When the price reaches $800, the broker executes the buy order.
In general, Buy Stop and Buy Limit orders are instructions that traders send to their brokers via the trading platform to execute trades at specific levels and prices.
- Buy Limit: The current market price is above the desired buy level. The expectation is that if the price drops to this level, it will not fall significantly further and will start moving upward. The trader instructs the broker to execute a buy trade once the price reaches this level.
- Buy Stop: The current market price is below the intended entry point. The trader waits for the price to rise to their target level to execute a new buy trade.
Short Selling (Sell/Short Orders)
Traditionally, profit in financial markets comes from buying a stock, contract, or asset and selling it later at a higher price. In modern financial markets, traders can also profit from price declines.
Sell trades allow traders to profit when they expect the price to fall. Once a trader identifies a level where they believe the price will not rise further, they instruct their broker to sell at that price. The greater the price decline, the higher the profit. In Persian, this is called معاملات فروش or استقراضی, and in English, it is referred to as a Sell or Short order.
Short (Borrowed) Orders
Short orders work by borrowing an asset to sell it first and later buying it back at a lower price.
Example: Suppose you expect gold prices to decline. You borrow 1 kg of gold from a friend, sell it at the current price of $1000, and later buy back 1 kg at $900 to return to your friend. The difference of $100 is your profit.
Financial brokers operate similarly. They lend you stocks or assets based on your account balance and margin. For instance, if you borrow 100 shares, you sell them, wait for the price to drop, buy them back at a lower price, and return them to the broker. The difference between the sell and buy price is your profit, calculated once the position is closed.
Trading Orders
To execute a trade, traders must send orders to the broker. These orders come in different types, depending on the situation.
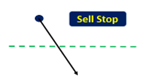
Sell Stop
In a Sell Stop, the current market price is higher than the price at which the trader wants to sell. The trader instructs the broker to execute a sell trade if the price falls to a specific level. This order reflects the trader’s expectation that the price will continue its downward trend.
When the price moves down and reaches the Sell Stop level, the broker activates the trade. The trader expects the price to continue declining, and they profit from the price difference in the downward movement.
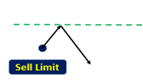
Sell Limit
Another type of trading order is the Sell Limit. A Sell Limit order is used when the current market price is lower than the level where the trader wants to sell. The trader expects that once the price rises to this specified level, it will reach a maximum price or market ceiling and then start declining.
In other words, the trader instructs the broker to execute a sell trade only when the price increases to the target level, because they anticipate that the price will not go higher than that point, and the market will reverse downward afterward.
Example to Clarify
To make the concept clearer, consider this example: Imagine that a trading instrument in the past reached a price of $1000, and then dropped sharply to $700. Now, after some time, the price is around $970, approaching that previous high.
Some traders, expecting the price to react as it did before, may want to sell at this level. However, the price has not yet reached $1000. They have two options: either monitor the chart until it reaches that level, or set a Sell Limit order at this price and continue with other tasks.
Conditional Orders
In general, Sell Limit and Buy Limit orders fall under the category of conditional (pending) orders. These are not executed immediately in the market but are triggered only when the price reaches the specified level. If the price never reaches that level, the order remains inactive.
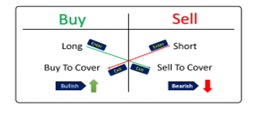
Closing Sell (Short) Positions
Every sell position requires an opposite order to close it, which is called Buy to Cover. This works as follows: a buy order is executed in the market with the same volume as the original sell, which closes the trader’s sell position.
- It doesn’t matter whether the trader is in profit or loss; closing is always done via a Buy to Cover order.
- In some markets, like Forex, the trader can simply click “Close”, and the broker automatically executes the opposite transaction.
- In other markets, such as cryptocurrencies, the trader must manually issue a buy order of equal volume to close the position.
Important Notes on Conditional Orders
- Chartical Jabal Ameli Method: Traders are recommended to use Sell Stop and Buy Stop orders rather than Limit orders. This is because the method relies on observing market volume, and Limit orders do not provide sufficient visibility for high-confidence reversal trades.
- Entering Trades: In Chartical Jabal Ameli, traders wait for confirmations before entering, which reduces risk. Limit orders would require entering without confirmation, which increases risk.
- Execution Speed: Pending orders are placed directly on the broker’s server, so they execute faster than immediate market orders, where data must travel from the trader’s computer to the broker and then to the market.
Number of Candles Required for Market Reading
A very important point is determining how many candles a trader should have on their chart to make the best decision for taking a trade according to the Chartical Jabal Ameli method.
Zooming the Market Chart and Candle Quantity
In psychology, there is a component called historical memory, which also applies to trading. Traders must understand how to use it to achieve the best results. To illustrate, consider the following examples:
Imagine a couple in the early years of marriage who try to surprise each other on various occasions—anniversaries, birthdays, Valentine’s Day, etc. Over time, however, they gradually forget some dates, not because of lack of love, but because new, more significant events dominate their attention—having children, career achievements, buying a house or car. The same applies to traders in the market: their decisions are influenced by historical memory. Past events affect current decision-making because they are remembered and used as a reference.
Similarly, traders need to consider past candles to make informed decisions.
Recommended Number of Candles
In the Chartical Jabal Ameli method:
- Maximum: ~60–70 candles.
- Minimum: even 20 candles are often sufficient to:
- Decide whether to trade in the market.
- Determine if the position should be long or short.
- Plan exit strategies.
Using more than 60–70 candles can expose your analysis to obsolete information that no longer impacts current market participants.
Chart Zoom
It is recommended to:
- Zoom in the chart to the maximum level.
- Then, reduce it by two levels.
This ensures that candle placement is optimal for market observation. Candles should not be:
- Too large → triggering unnecessary fear or excitement.
- Too small → making it hard to detect shadows and subtle price movements.
Traders should focus on what current influential market participants are observing, not dead information that no longer affects price action.
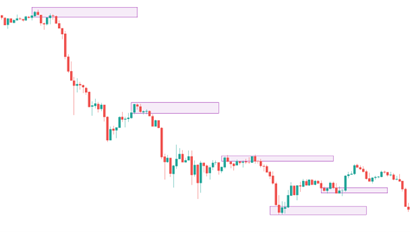
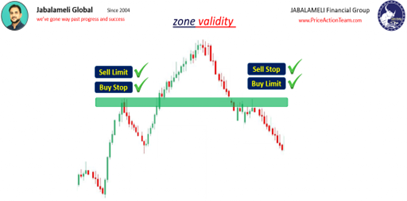
Rule of Invalid Levels
Not all levels in the market are valid, and you do not need to wait for reactions at every level.
When Levels Become Invalid
- Consider a level that price has broken once to the downside. This is called a breakout.
- When this happens, all Sell Stop and Buy Limit orders in that range are activated.
- Later, if the price moves upward and breaks that level again, all Buy Stop and Sell Limit orders are activated.
As a result, no more pending orders remain in that level. Any reaction observed afterward is random, and relying on it for trading is unreliable.
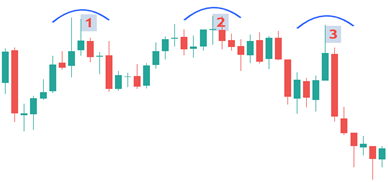
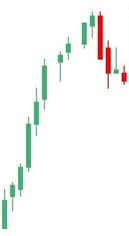
Swing Reactions and Trading Orders
In the image above, after a strong price move, a correction has formed. The last peak on the left side of the chart is significant for many traders:
- Some traders wait for the price to reach the last peak to buy.
- Others, believing the price has already dropped from this point and will not rise further, wait to sell at that level.
In the market, traders have different mindsets and methods. In Chartical Jabal Ameli, the key point is that both types of orders are activated when the price reaches the range of the last swings.
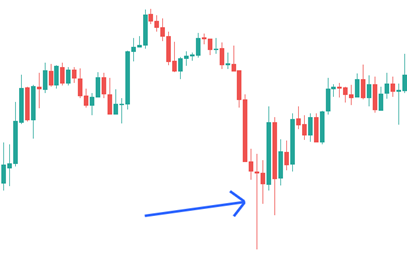
As the market continues, if the price drops for any reason and then returns to that point:
- Buy Limit orders (expecting the price will not go lower) and
- Sell Stop orders (expecting the price drop to continue)
will both be activated.
Implication: All possible types of trading orders at this price level—based on the last swing—have been triggered. No further price reaction should be expected at this level in the future.
In simple terms:
Once the price passes through a range twice, that swing becomes invalid, and the level no longer matters for trading. From then on, the trader should focus on newer swings where pending orders have not yet been activated.
This highlights that financial markets are extremely dynamic. Price movements continuously create new swings and patterns. A trader who does not analyze the market based on financial logic and practical knowledge may mistakenly believe every movement is meaningful and has a specific reason, leading them to seek rules and trade according to false assumptions.
Market Text (Framework of Market Information)
In the Chartical method, we have learned:
- How to identify market swings.
- Why these swings are important.
- Which swings are relevant for trading and which are not significant.
The market text refers to everything observed on the chart of a trading instrument:
It is the total number of candles used to identify clues and apply techniques to predict the market’s future with the highest probability.
In other words, market text = the visual information on the chart that guides the trader in decision-making according to the Chartical Jabal Ameli method.
Market Text Framework – Highest and Lowest Effective Swings
For example, consider a chart where we identify one swing at the highest point and one swing at the lowest point. This means there are two effective swings in the market text—the highest and the lowest.
Although other swings may exist between these extremes, the focus is currently on the highest and lowest. This range is called the Market Text Framework.
Application in Chartical Jabal Ameli
When a trader wants to make a market decision:
- Suppose they are looking to sell and the price is near the lower boundary of the market text framework. Although the market may show clues suggesting a sale could be profitable, these are often false signals, and entering a sell trade here is likely unsuccessful.
- Conversely, if the price reaches the upper boundary, buy signals may appear, but a purchase should not be made. This upper boundary is a critical tension level, capable of significantly affecting price behavior. Any apparent buy clues here are false signals, and a trader should instead consider selling.
A professional trader always seeks entry points where large or institutional traders—the ones who drive trends—are entering or have recently entered.
- If the price has traveled a long distance from one end of the chart to the other, large traders have likely already entered at better points, meaning they either cash out part of their positions at this level or observe retail traders buying at worse prices to gradually liquidate their positions.
Expert Insight
According to Warren Buffett, trends often form at points unnoticed by most people, including many intelligent traders. New and strong trends typically emerge at levels that 90–95% of traders do not expect, leading the majority to act in the opposite way.
Key takeaway:
- The Market Text Framework is the range between the highest and lowest effective swings.
- At the upper boundary, a trader should not buy.
- At the lower boundary, a trader should not sell.
- Following the actions of major traders is crucial for success.
Trend Formation
In the Chartical Jabal Ameli method, trends are formed by:
- Large traders or a collective of many medium and small traders who together have enough capital or market influence.
- Small retail traders alone cannot create trends.
When large or diverse groups are absent, the market becomes volatile and erratic, and trading in such conditions—either buy or sell—typically leads to losses. Traders may attempt revenge trades or use strategies like hedging or martingale, which are risky.
Thus, identifying liquidity in the market is essential. Success in financial markets depends less on having large funds or analytical knowledge and more on acting on valuable information earlier than others.
Trend Initiation
Like all events, trends do not appear suddenly—they have a starting point.
- Traders do not need multiple higher highs or lower lows, multiple touches on channel boundaries, or an indicator breakout to identify a new trend.
- Entry should occur when other market participants are willing to buy or sell at worse prices out of eagerness or pressure. Entering at this stage allows the trader to profit as price moves in their favor.
In Chartical Jabal Ameli, trend identification does not rely on indicators or patterns. Instead, professional traders are recognized by:
- Fewer confirmations needed for trades
- Stronger, more reliable market clues
Every price movement observed in the market is referred to as a “leg”
Legs, Extensions, and Corrections
For example, in the chart above, all marked points represent legs of price movement, each with distinct characteristics.
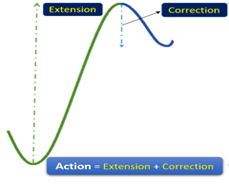
- Extensions:
Legs that are strong, large, and move more smoothly with more candles are called extensions.- Definition: An extension is a strong leg of price movement.
- Corrections:
Legs that are weaker, smaller, with fewer candles, or that move more slowly are called corrections.- Definition: A correction is a weaker leg with shallower movement and fewer candles.
Important Note:
- Weakness is a defining feature of a correction,
- Strength is a defining feature of an extension.
In the schematic below, you can see:
- The larger and stronger part of the movement is the extension (also referred to as a “leg”),
- The smaller movement, usually with a gentler slope, is the correction.
Trends and Market Movements
We have understood that trends are created by large traders or an aggregation of many traders. The core principle of profiting in financial markets is having knowledge and awareness before others. A trader should always look for clues to identify the strength or weakness of market participants, one of which is the observation of extensions and corrections.
Uptrend (Bullish Trend)
To identify a trend, price movement needs to be observed. A trader must align with large traders and big money in the market. This does not mean simply following higher highs or higher lows, or noticing an upward-sloping trendline or channel formed after three or four touches, or an indicator breakout. These are patterns almost all traders can recognize.
Some very important principles form the foundation of our method:
- Nothing in the market occurs instantly. Every beginning has reasons and signs.
- For an uptrend to form, a price movement upward is required.
- For a price movement, extensions and corrections are necessary.
We have learned that:
- An extension is a strong leg of the market movement.
- A correction is a weaker retracement.
- The attributes of strength in extensions and weakness in corrections are extremely important.
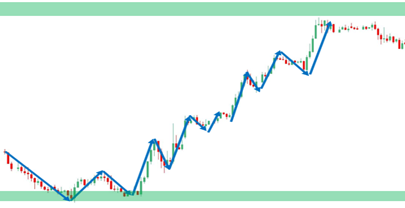
In the Chartical Jabal Ameli method, whenever a strong upward extension is followed by a weak downward correction, a bullish movement is established. As long as this sequence of extension followed by correction continues to repeat, the uptrend persists.
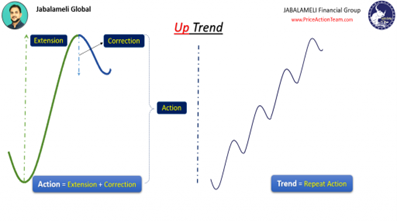
As seen in the image, after the first extension and correction, we observe another extension and correction in the same direction, indicating that the trend continues. Subsequently, another extension followed by a correction occurs in the same direction, showing that the trend is still active.
As long as extensions and corrections continue in the market, the trend persists. A trader should not rely on indicators or levels formed in the market, such as Fibonacci levels, but should instead follow the price action itself. However, to enter trades with higher confidence, a trader should not necessarily enter on every extension or correction.
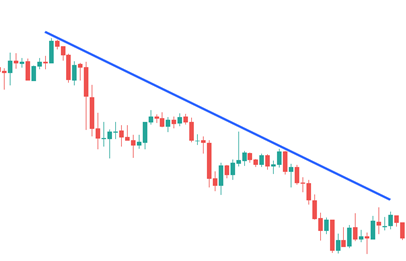
Downtrend (Bearish Trend)
In the Chartical Jabal Ameli method, for a downtrend to form, there must first be a downward movement, preceded by an extension toward the downside and a correction against it.
As shown in the image, to observe a downward movement, we need a downward extension followed by a weak correction. This forms a downward movement. As long as these extensions and corrections continue, the downward movement and trend will persist.
In this section, we have become familiar with two types of trends: upward and downward, which are composed of extensions and corrections. As long as these extensions and corrections continue in one direction in the market, the trend will continue. This highlights the importance of being able to follow the trend from its first move.
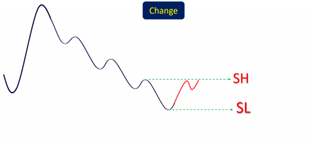
Trend Ending
In the Chartical Jabal Ameli method, to determine the end of a trend, whether upward or downward, attention must be paid to the latest swings.
Look at the image: the movement circled shows the last upward price movement, which is formed from the last major swing lows that led to the highest and most recent swing highs. When the price breaks the major swing of the trend downward in any way, the upward trend comes to an end.
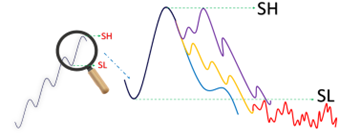
As shown in the image with different colors, from the last swing highs to the last swing lows, the price may have moved in any way. It does not matter whether the price made this movement all at once or made several attempts in different forms between the swing high and swing low. The only important point is that the last swing low, which led to the highest and most recent swing highs, is broken by the price.
The End of a Trend Does Not Mean a Reversal
It is possible that immediately after the end of a trend, the opposite trend does not start. In other words, we may not observe downward extensions or corrections, and the price could move in a choppy or ranging manner.
For a downward trend, the same principle applies. The price may continue making movements to decline. Therefore, whenever the last swings leading to the lowest and most recent swing lows are broken by the price in any manner, the downward trend has ended.
This break can occur in two movements, or, as shown in the image, in one movement. Even if the price ranges in between, the trend is considered ended once the swing low is broken.
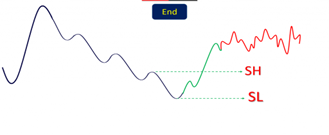
We have understood that it does not matter how the last swing of a trend is broken. The only important point is that the last swings leading to the lowest and most recent swing lows are broken by the price.
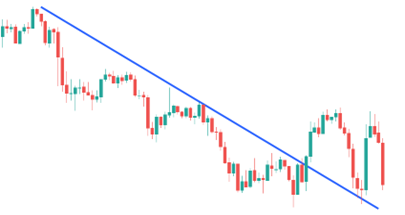
Trend Change
As we have learned, in the Chartical Jabal Ameli method, for the end of a trend—for example, an upward trend—it is necessary that the last swing low, which led to the highest and most recent swing highs, is broken by the price.
However, for a trend change, it is enough that between those two swings, a strong downward extension and a correction against it occur. In such a case, the upward trend ends, and a downward trend begins.
According to the definition of a trend, for a trend to form, the price must first make a movement, which requires a strong extension followed by a correction. In other words, the trader can recognize a trend change even before the last swing is broken.
Please refer to the image below:
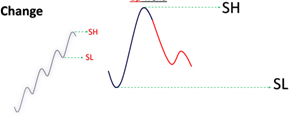
In the image above, for a downward movement, we have a downward extension followed by a correction against it.
An important point is that the price must correct more than 55–60% of the extension in order for it to be considered a valid downward extension. By “correction percentage,” we mean that if the difference from the swing low to the swing high is, for example, 100 pips, the price must move more than 50 pips downward in a single extension to qualify as a downward extension. After this, one should wait for a correction against it to confirm that the uptrend has changed into a downtrend.
For a downtrend, it works in the same way. To shift to an uptrend, we need an upward movement, which consists of an upward extension followed by a weak correction against it. Whenever we observe in the market that the price between the last swings, which formed the lowest swing low, creates an upward extension followed by a correction, the downtrend has ended and an uptrend begins.
It is important to understand that the end of a trend does not necessarily mean a trend reversal. In summary:
- When the last swing low in an uptrend is broken, it marks the end of the uptrend, and the trader should no longer look for buying opportunities to continue the previous trend—at least until the market situation becomes clear.
- If a strong downward move occurs with a depth greater than 50% of the previous movement, followed by a weak correction in the opposite direction, a new trend may begin.
Range Areas and Principles for Identifying Them
Previously, we learned about trends and realized that sometimes trends end and sometimes they change. For example, an uptrend may eventually, after forming the last swing, enter a range.
In general, a ranging trend (or sideways trend) does not have a specific direction. Unlike an uptrend, where price moves upward with strong upward extensions followed by weak downward corrections, or a downtrend, where all movements point downward, a sideways trend moves more horizontally and without a clear direction.
Sideways Range (Sideway)
Sometimes, market makers or liquidity providers are not given specific instructions to push the price to a particular level. Instead, they maintain the price within a specific range.
As shown in the image below, these participants trade within swings by buying at the lower part of the market range and closing or selling at the upper part. They create fluctuations and maintain the price within the boundaries of the market text (the observable price range).
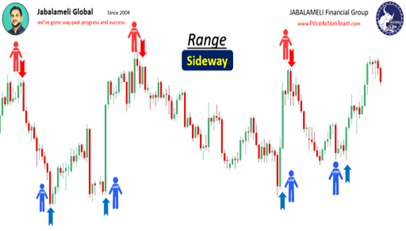
In the Chartical Jabal Ameli method, this type of ranging market is called a sideway (Sideway range). A sideway is a type of ranging market where liquidity is present, meaning that influential traders are active, but they do not want to push the price dramatically to much higher or much lower levels.
In a sideway market, the price can move in various ways:
- In one scenario, as shown in the image above, the market text may start moving from top to bottom or bottom to top and include several extensions or corrections.
- Another scenario is that in the same market text, the price may rise with two upward extensions and fall with one downward extension.
The main point for traders is that there should be enough distance between the two edges of the market framework to:
- Enter a trade with a defined stop-loss,
- Gain a trade with minimal cost but maximum potential profit,
- Ensure that the distance between the swing low and the swing high in the market text is sufficiently profitable for entering a trade.
The sufficient distance depends on the trader’s timeframe and the price volatility. This means that the trader should pay attention to which timeframe they are observing and what level of volatility exists in that timeframe.
How to Identify a Sideway Range
One way to detect a sideway market is:
- If the price forms 3 swings between the last swing low and the last swing high, it indicates that the market is entering a range.
Refer to the image below for illustration.
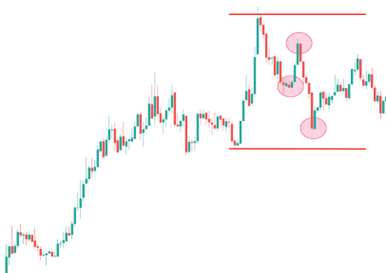
Sideway Range
A sideway range is a type of ranging market where the distance between the market’s high and low is enough to allow a trade to be executed and properly managed. A sideway range has defined highs and lows, so traders can anticipate potential price reactions at these points.
Choppy Range
A choppy range is another type of ranging market, but it is not suitable for trading, because unlike a sideway range, large or institutional traders are not active in it.
- In a sideway range, although large or institutional traders were not given specific orders, the market was still considered suitable for swing trading.
- In a choppy range, not only are institutional traders absent, but even the traders present do not see the market as suitable for entry, so they prefer to operate elsewhere.
As a result, the market exhibits erratic and unpredictable movements, where candles frequently overlap. The absence of large or institutional traders causes the following:
- Price movements are small and directionless,
- Movements are irregular, and upper and lower shadows often cancel each other,
- Unlike a sideway range, where movements from low to high or high to low are clear and structured, a choppy range has compressed and irregular swings.
In other words, in a choppy range:
- It is difficult to find precise entry points,
- Placing a reliable stop-loss is challenging,
- The distance between the high and low of the range is too narrow to be profitable for trading.
This type of range is called a Choppy Range.
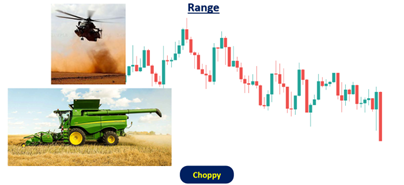
As seen in the image above, there is no opportunity to enter or manage a trade. The price movements are so chaotic that it is impossible to define clear entry and exit points, and sometimes the stop-loss levels are not clearly identifiable.
The main reason for this situation is the absence of large traders, which results in insufficient and uncoordinated liquidity, usually caused by the dominance of small retail traders. Therefore, these areas are not suitable for trading.
Due to the completely irregular and directionless movements, this type of range is called a Choppy Range—similar to the turbulence created beneath a helicopter or combine harvester. A professional trader does not trade in such a chaotic market where the main players are absent. There is no reason to act when the major market participants are not present.
- If a trader opens their trading platform and encounters a choppy market, they should simply avoid it.
Whenever the price oscillates within a clearly defined range where there is a trading opportunity, manageable stop-loss, and defined entry/exit zones, this area is called a sideway (parallel) range. Conversely, if the distance between the highs and lows is very narrow or the market is chaotic, the range is choppy.
Note:
- In a sideway range, traders are only allowed to buy at the lows and sell at the highs,
- Traders should use fixed take-profit levels within these zones.
Change and End of Sideway and Choppy Ranges
The change or end of sideway and choppy ranges occurs when market movements begin to show a clear upward or downward direction. In other words, this market state, like other market conditions, is not permanent. The market eventually reaches a point where a strong extension and weak correction can again be observed in the upward or downward direction.
This is similar to what happens when trending markets end: the market continues to move to a certain point, and due to traders taking profits, new entries, or other reasons, the market starts reversing or changing direction.
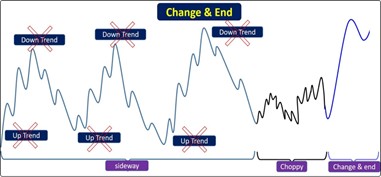
If you pay attention to the image above, you will notice that the market starts with a sideway trend, continues with a choppy range, and finally ends through an upward movement.
In other words, similar to the end of trends, whenever a strong move occurs in any direction within a range, and the opposite move cannot match its strength and only appears as a weak correction, this acts as a warning signal that the range is ending.
Notice that in a sideway range there is no trend, which is emphasized in the image with a cross mark.
A very important point that every trader should always remember is that in the market, they are looking for the footprints of the big money. Everything that has been explained so far, and everything you will learn in the future, is aimed at finding these footprints.
- Suggestion: It is recommended that learners open their trading platform and, without executing any trades, practice observing the market and applying what they have learned so far in a real market environment.
Chapter Three
Chartical Jabal Ameli: Chartical Clues in Trend Changes
At least once, every trader has experienced a situation where, after identifying a strong trend and entering the market, the price reverses or begins a prolonged ranging movement.
The point addressed in the section on trend-change clues is understanding how long the traders who have created this strong trend intend to remain in it.
Sometimes, what a trader expects from the ongoing trend before entering the market does not happen after the entry. In the Chartical Jabal Ameli method, the trader must pay attention to who is currently active in the market: organizational traders, professional traders, or retail traders? In what direction and with how much capital are they participating? And how long will they remain in the market?
Traders’ Party Analogy
Imagine being invited to a party at a specific time and place. You know the schedule, the hospitality, other guests, and the customs of the event. But if you arrive after the announced time, what happens? Naturally, you find a messy and empty venue—the guests have left, the musicians are gone, the food and drinks are finished, and you have missed all the enjoyment.
This analogy applies to trends as well. Before the trend ends, there is a lot of capital, excellent reactions, and sharp movements. But once the traders who are driving the trend leave the market, entering it is like arriving at a party after it has ended. The participants and activity are gone, leaving only an empty and disorderly scene.
Thus, just as identifying a trend is important, entering at the right time and predicting how long it will last is equally vital. Otherwise, after entering, the price may move against the trend or enter a ranging phase.
Through clues given by candlesticks, by analyzing changes in the flow of orders, a trader can detect this. This does not mean using Steve Nison candlestick patterns; rather, the trader should use candlestick behavior as a record of the actions of influential market participants over specific periods.
Pay attention to the image below:

When the price moves, it leaves patterns behind, similar to the image above (in financial markets, this pattern is called a candlestick, or simply a candle).
A candlestick can vary in size, length, or even color—for example, some may be green and others red. There is a wide variety of shapes and sizes for candlesticks, but essentially, there are only two colors.
Now, take a look at the chart below, which shows a series of candlesticks.
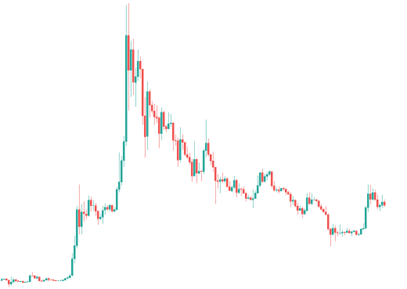
In the Chartical Jabal Ameli method, regardless of the shape or color of candlesticks, the trader must follow the clues that price action provides. To do this, careful candlestick analysis is required.
Candlestick (Candle)
In general, a candlestick represents a specific time period, with an opening time and a closing time.
- For example, if a trader selects a daily timeframe, a new candlestick forms every 24 hours that the market is open.
- If the trader chooses a one-hour timeframe, a new candlestick forms every hour.
This means that each candlestick on the chosen timeframe reflects all price activity within that period. In simple terms, if a 4-hour timeframe is selected, one candlestick closes every 4 hours, and a new one begins. Each candlestick within that timeframe represents the behavior of traders during those 4 hours.
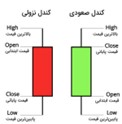
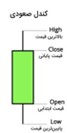
Open and Close
- Every candlestick has an Open (O) — the price where it starts at the beginning of the time period.
- Example: In a one-hour timeframe, at 10:00 AM, the price might open at $1000.
- Each candlestick also has a Close (C) — the price at which the candlestick finishes at the end of its timeframe. Once closed, the candlestick cannot change, and all subsequent price movement is reflected in the next candlestick.
High and Low
Within a candlestick, there is also a highest price and a lowest price:
- In the Chartical Jabal Ameli method, the highest price is called High, and the lowest price reached in that timeframe is called Low.
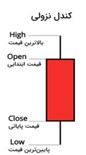
Candlestick Color and Trend Indication
- If the closing price is higher than the opening price, the candlestick is bullish (upward) and shown in green.
- If the closing price is lower than the opening price, the candlestick is bearish (downward) and shown in red.
Important: The closing price is the only reference point for decision-making. Observing a candlestick allows the trader to see whether the most recent trader activity in the market was bullish or bearish.
The Four Key Attributes of a Candlestick
Every candlestick has four key prices that are crucial for traders:
- Open – starting price of the candlestick.
- Close – ending price of the candlestick.
- High – the highest price reached during the candlestick.
- Low – the lowest price reached during the candlestick.
When a trader wants to analyze price behavior and look for clues of market changes, they must ask:
- What is happening in the market right now?
- Are the large traders still active?
- If so, will they continue, or when will they enter?
To answer these questions, one must examine the candlestick from its High to its Low, i.e., from the highest price to the lowest price reached during that period. Regardless of the candlestick’s color or shape, the candlestick should be divided into three equal parts, because the closing price in each part has a different meaning.
In the illustration below, these three segments are highlighted.
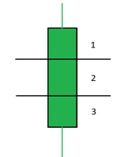
Close in the Upper Third
If the closing price is in the upper third of the candlestick (the area shown in the illustration below), there is a higher probability that the next candlestick will also move upward in the near future.
Why This Matters for Traders
This information is crucial for a trader because entering a new trade should ideally occur when there is a higher probability of success and minimal capital at risk. The optimal entry point is where the price immediately moves toward the profit zone, so the trader avoids being stuck in a loss or stagnant position and can start gaining almost immediately.
Close in the Lower Third
If the candlestick closes in its lower third (the area shown in the illustration below), there is a higher probability that the next candlestick will move downward. In this scenario, if the trader is looking to enter a sell position, it is an appropriate time to enter the market.
This helps the trader avoid getting caught in the market’s grinding movements. When planning a buy or sell trade, the trader should not enter on every candlestick, because doing so could lead to a trade with high capital at risk. The price might initially move slowly or sideways before reaching the profit zone, and there is also the possibility of having to exit the trade prematurely.
Close in the Middle Third
If the candlestick closes in its middle third, the price is likely to continue moving sideways (range-bound) for one or two more candlesticks. This principle also applies to movements (moovements). When a trader manages open trades, the goal in the Chartical Jabal Ameli method is to maximize the market’s potential. By evaluating the strength of each candlestick, the trader can decide whether it is safe to stay in the trade or if an exit is advisable.
Candlesticks reflect the latest behavior of influential market participants, and traders should use them to guide their trading decisions.
Note: The importance of candlestick closes is not uniform; it becomes especially significant in critical points of the market, such as at the end of corrections or the conclusion of major movements.
Types of Corrections (Carctions)
One of the most important clues in trading is the correction, which provides useful information for trade entries. In the Chartical Jabal Ameli method, corrections come in various forms, which we will explain.
Extensions and corrections in markets are like human breathing. Just as humans need both inhalation and exhalation to live, markets require both extensions and corrections to remain healthy. Whenever the market moves continuously upward or downward without correction, the trader should realize that the current timeframe is not suitable. They may need to move to a higher timeframe, and if the higher timeframe also shows the same behavior, it could indicate that the price is unhealthy or inflated, forming a bubble.
In the Chartical Jabal Ameli method, when markets correct, they create trading opportunities—both for continuation trades and reversal trades. Corrections are essential for market health, and we will discuss them in detail in the following sections.
Types of Corrections
Although corrections are the market’s “breath” and are necessary for its health, the type of correction also provides clues to traders. For example: How much liquidity exists in the market now? How significant will upcoming price movements be? A trader must first become familiar with the different types of corrections in terms of technical characteristics and visual appearance.
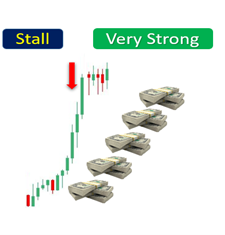
Stall Correction
One type of correction is the stall correction. As shown in the illustration, in a stall correction, after an extension is complete, the price cannot retrace more than 15% of the extension, meaning the correction is shallow. For example, if an extension moves 100 pips, the stall correction cannot retrace more than 15 pips (15%), so it does not significantly reverse the movement.
Pressure in a Stall Correction
The pressure present in a stall arises from traders who, driven by stubbornness, desires, and emotions, have invested large amounts at unfavorable levels. According to auction theory, they continuously and aggressively trade, creating a strong force in the market.
Due to the emotional and desire-driven pressure of these traders, the extension is substantial. When the price attempts to form a correction, the liquidity pressure prevents it from retracing more than 15% of the extension distance, resulting in a stall correction. The stall typically lasts 3 to 5 candlesticks. In other words, the pressure must be strong enough that the price cannot remain in that region longer and must continue its movement.
A trader should note that stall corrections form after a spike. The spike represents the first movement (extension) of a new trend, which is very strong and begins with small candlesticks. Gradually, the candlesticks grow larger. This means that stalls can only appear at the beginning of trends. Stalls do not appear in the second or third steps of a movement. If a retracement resembling a stall occurs later in the trend, it is still strong in terms of trader participation, but it does not have the quality of the first step. Such occurrences mid-trend can happen due to false excitement, like a news release.
To identify a stall-type correction, the trader must observe 3 to 5 candlesticks. If the correction lasts more than 5 candlesticks, the movement is considered choppy (disorderly). If it is fewer than 3 candlesticks, it is a normal behavior continuing the extension.
Because of the strong financial determination of the traders creating the extension, when the price attempts a correction, it cannot retrace significantly, usually only up to 15% of the extension, making the stall correction the strongest form of retracement.
The next type of correction is the pullback correction. After the price forms an extension, a correction is expected; however, the maximum retracement of this correction should not exceed 50% of the extension distance.
For example, in an uptrend, if the last extension was 100 pips, the correction should not drop more than 50 pips. If it exceeds this, the movement is no longer considered a correction but rather a new extension. In such cases, if a weak correction is observed, it is expected that the downtrend will continue.
Another type of correction, which is common, weak, and frequently seen in the market, is the simple pullback. A simple pullback means that after an extension, the price retraces between 15% and 50% of the extension.
Why shouldn’t the correction exceed 50%?
Pullback Complex
Suppose that to create an upward extension, the price requires 100 lots or 100,000 contracts to be traded. Naturally, a strong movement has formed in the market, resulting in an extension.
Now, if the price retraces up to 50% of the extension, it can be inferred that the traders who created the extension—whether bullish or bearish—are still at least 50% present, meaning their intent has not changed and the price movement in the previous direction remains strong.
However, if the retracement exceeds 50%, for example reaching 60%, it indicates a significant shift. Using the previous example of 100 units traded (assume these are buy trades), a 60% retracement implies 60 units of selling have entered the market while only 40 units of buying remain. This means a smaller portion of the original extension creators is still active.
Thus, even if a strong move occurred, the nature of the correction is very important. Through this analysis, one can assess whether the larger community of extension creators is still in control. For example, if the correction reaches 60%, the stronger portion is now with the 60% retracement. If a counter-move forms in this scenario—for instance, in an uptrend—then the upward move is no longer dominant, and a downward movement may be forming, or at the very least, the market has entered a range (sideways) phase.
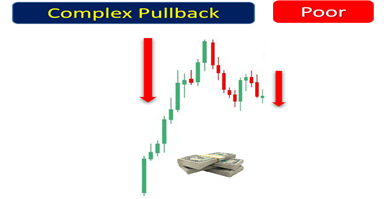
Weak Complex Pullback
The weak complex pullback represents the weakest state of a trend, because the traders who created the extension were not strong enough or persistent enough to maintain control. When the market enters a correction phase, they only allow the price to pull back once, resulting in a single pullback.
In contrast, opposing traders are able to push the price back twice, creating two counter-moves against the original extension. This scenario is referred to as a complex pullback or multiple correction.
As observed in the image above, the price, like in a simple pullback, initially retraces and even appears ready to move again. However, due to either a lack of strong buying from the bullish traders or excessive selling pressure from the opposing sellers, the price fails to resume its upward move and cannot form the next extension. Instead, it falls again. In this case, a complex pullback or multiple correction is formed, indicating either a weakening of the traders in the trend direction or a strengthening of the traders opposing the trend.
In a complex pullback, there are two retracement legs, meaning the price experiences two consecutive pullbacks within the correction.
Another scenario also exists, which occurs purely over time. In this case, as shown in the image below, the corrective movement can either happen as two consecutive pullbacks or as a gradually extended corrective move, where weak, indecisive candlesticks—reflecting low liquidity or trader uncertainty—form over a prolonged period. This results in a correction that is extended in terms of time.
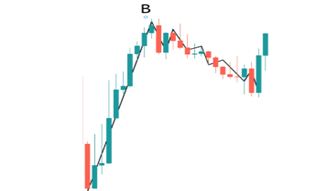
So, whether in scenario A or scenario B, a complex pullback or multiple correction exists. This represents the weakest state of the trend, and the trader should avoid trading in such a market or enter with reduced position size, because the price behavior indicates that the trend is in a weaker phase. However, it should still be noted that this is, in any case, a pullback, and like any correction, it comes with weakness. As mentioned earlier, the price retracement should not exceed 50% of the main movement.
Reversal Pullback
The next type of correction is the reversal pullback. The correction models we reviewed earlier were designed for continuation trades, meaning they were intended for situations where the trader wants to enter in the direction of the trend.
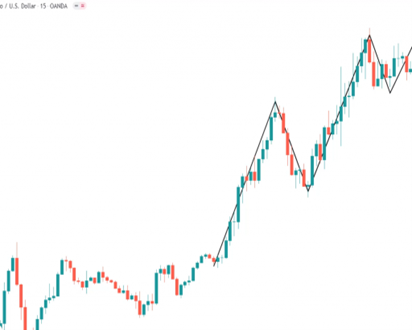
However, when a trader intends to take a position against the trend, as shown in the illustration above, a correction still needs to be observed. As previously mentioned, corrections and the behavior of traders in that area are very important. In this illustration, the correction manifests as a “failed to continue”, meaning the price created an extension, and the correction appeared as a pullback. When the price attempted to move beyond its last swing high to form a new extension, it failed.
In the Chartical Jabal Ameli method, this situation is considered a failed to continue, representing an inability of the price to extend further. This is called a reversal pullback, which traders can use to enter countertrend trades. In other words, traders in the current trend were unwilling to buy at higher prices.
The same concept applies to sell trades: if there is a downtrend, and during the last extension the price forms a correction but then fails to continue in the direction of the trend, it turns into a reversal pullback, signaling an opportunity for countertrend entry.
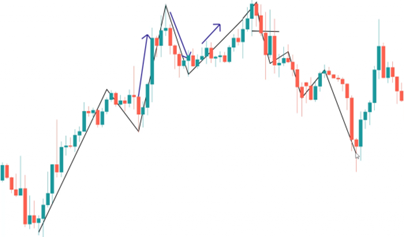
In the Chartical Jabal Ameli method, a trader is only allowed to look for reversal pullbacks at the upper and lower edges of the market framework. According to trend principles, the trader is not permitted to assume a reversal until the price reaches the opposite boundary. Therefore, reversal pullbacks should only be expected at the top and bottom edges of the market structure.
We have learned that in this method, corrections (or pullbacks) are valuable clues for identifying and entering trades. These corrections come in different types: stall correction, pullback, complex pullback, and reversal pullback.
- In a stall correction, after an extension is completed, the price cannot retrace more than 15% of the extension.
- If the correction after an extension retraces more than 15% but less than 50%, it is considered a pullback.
- The weakest type of correction is the complex pullback. If the price moves in a complex pullback and a trading opportunity arises, the trader should enter with reduced risk, committing less capital. This ensures enough capital remains available for other opportunities like a simple pullback, stall, or reversal pullback that occur at sensitive market levels. Determining exact entry timing requires additional clues, which will be discussed in later sections.
Projection
In this section, we discuss assessing the strength of price movements based on extensions. By observing the clues provided by extensions, a trader can predict, over larger scales or further into the future, the strength of the trend.
Definition:
A projection is the net price throw. As shown in the illustration, a trader calculates the extension of a price movement by subtracting the preceding correction. The remaining distance represents the projection.
The trader then compares each projection to previous projections. For example, if the first projection is A and the second is B, the trader observes whether the current extension is smaller, equal, or larger than the previous one.
- If the current projection is smaller than the previous, the trend creators (traders driving the movement) are losing strength, and the trader should avoid trading in this market. Even if external signals (from social media, software, apps, or indicators) suggest a trading opportunity, a professional trader ignores it. A clear reduction in liquidity signals that the market is no longer attractive for trading.
- If the current projection is equal to the previous projection, the situation among the trend-driving traders is unchanged. If a trading opportunity arises, the trader can use it to enter a new position.
- If the current extension (B) is larger than the previous extension (A), the trader can enter with confidence, possibly increasing their risk proportionally to their psychological and financial capacity. This is because the trend-driving traders are strengthening, making the trend more reliable for trading.
In summary, projection analysis allows the trader to gauge the strength of the trend, decide when to enter, and determine how much capital to risk, based solely on observed market behavior rather than external news or speculation.
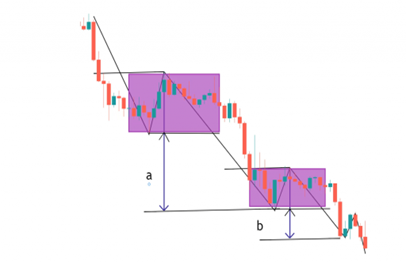
Now, focus on the illustration above; this concept also applies to downtrends. A trader must consider the extension in a downward move and the previous correction. In other words, as shown in the illustration, the trader subtracts the hatched area (the correction) from the total extension to obtain the projection or net price throw. The same method is applied to the next extension.
For example, if an extension covers a certain distance, the trader should exclude the portion of the extension that occurred within the correction, as highlighted in the hatched area of the illustration. The remaining portion represents the projection, i.e., the net distance the price has moved.
- As long as projection B is smaller than projection A, it indicates that the selling traders driving the downtrend have weakened for reasons that are irrelevant to the trader. In this case, traders using the Chartical Jabal Ameli method avoid entering a market where the trend-makers have weakened.
- Conversely, if projection B is equal to or greater than projection A, the trader can enter with confidence because the trend-driving traders remain active or have strengthened. Therefore, the trader confidently looks for selling opportunities.
In summary, projections provide clues. By comparing them, a trader can predict how strong the trend will be on a larger scale or further into the future, whether the trend-driving traders are weakening or strengthening, and how willing they are to participate in new trades.
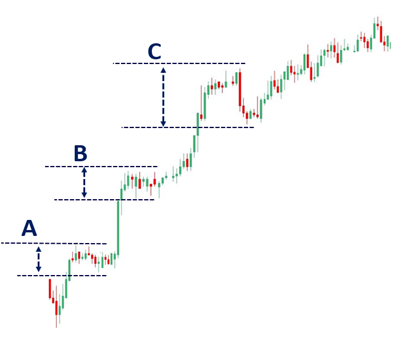
Focus on the illustration above; the highlighted areas represent how much the price has been pushed back during the correction relative to the extension. To measure this, we first label the first area as A and the second area as B.
The key point is that, just like in the projection method, each depth should be compared with the previous depth:
- If the new depth (B) is smaller than the previous depth (A), it indicates that counter-trend traders have weakened, or if they have not weakened, the trend-driving traders have become stronger. In either case, the price is less likely to behave dangerously against the trend. This allows the trader to take trades with lower risk and higher probability.
- If depth B is equal to depth A, there has been no significant change in counter-trend traders’ behavior or intentions. If other available signals indicate a valid entry, the trader may take the opportunity.
- However, if, as in the example, depth C becomes larger than depth B, it means counter-trend traders have strengthened, and their influence on the market is increasing. This may also indicate that trend-driving traders are weakening relative to the opposition. In such cases, even if the price appears to signal an entry, the trader should avoid taking the trade, as it may be a trap or simply a random occurrence. Random or stochastic movements frequently happen in the market. A trader who looks only at a single signal or candle in isolation may make poor decisions based on market noise, whereas a professional trader evaluates multiple factors before making a final decision.
A professional trader avoids getting trapped by excessive market randomness. When the depth of corrections or price movements increases significantly, that position is not traded.
The same logic applies to downward movements. In a downtrend, the trader must subtract the pushed-back portion of the price from the previous extension. As long as depth B is greater than A in a downtrend, the trader should not initiate new selling positions. However, if B is equal to or smaller than A, the trader may prepare to enter new selling opportunities.
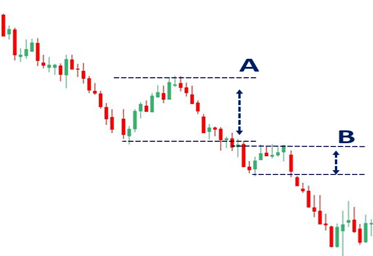
By analyzing the depth of corrections within a trend, we gain another important clue:
- If the depths are decreasing, it may indicate a weakening or lack of willingness of counter-trend traders to enter the market, which is a positive signal for trading in the direction of the trend.
- If the depths are increasing, it can serve as a warning that counter-trend traders are gaining strength, or that trend-driving traders are weakening. This may indicate that the trend is approaching its end or can act as a warning signal for potential reversal trades.
However, it is important to remember that a trader should not act based on a single indicator or signal. A set of clues should be considered collectively to reach a reliable trading decision.
Step Angles (زاویه¬ی گام ها)
We understand that trend-driving traders are responsible for projections (price throws), while counter-trend traders are either trapped or attempting to reverse the trend.
In analyzing the change in step angles, the trader must observe intentions that have not yet been fully revealed—those subtle indications that can help detect large trades entering the market or heavy trades that have finished and will not continue.
Both types of trades are important because a trader does not necessarily need confirmation of a large volume entering the market. Even knowing that a significant volume has exited can influence trading decisions.
Detecting the End of a Range with Angles
Sometimes, it is not necessary to wait for a full extension to break a range and generate a correction. The market may provide early clues that allow the trader to determine the best current behavior—whether to buy or sell—even in a choppy market.
Occasionally, a range may form, and a trader relying solely on conditional buy orders at the top and sell orders at the bottom may enter the market gambling on chance: whichever order executes determines the trade, while the other cancels.
In the Chartical Jabal Ameli method, a trader does not gamble. They do not trade blindly waiting for an outcome. Instead, they trade based on high-probability observations of what is actually happening in the market. This principle is a critical rule in professional trading behavior.
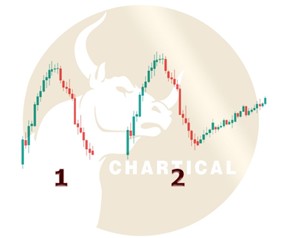
Sometimes, a trader must gather clues from the angle of market movements.
In Figure 1, you can see an upward angle and a downward angle, but these two movements do not provide significant information by themselves.
With closer observation, however, it becomes clear that the next upward angle (Figure 2) is flatter compared to the previous extension. Here, the trader understands that those participants who are spending their money to buy in the market no longer show strong persistence to trade at worse prices. They may even push the price higher, but they are currently reluctant to enter aggressively due to psychological or emotional reasons. In other words, they have the capital and ability to trade, but for some reason, they are temporarily refraining from doing so.
Increasing Angle
As shown in the image below, another scenario exists where the next angle becomes steeper compared to the previous movement. In this case, the trader realizes that, for some reason, buyers are trading their money with more excitement, greed, and enthusiasm, even at worse prices.
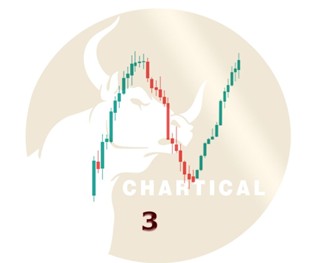
So, in general, as long as the upward step angle in the market is decreasing, if any tool, pattern, or trading method signals a new buy trade, the trader should not enter that new buy position.
However, if the angle increases, then after observing sufficient confirmation or signals, the trader can execute a new buy trade.
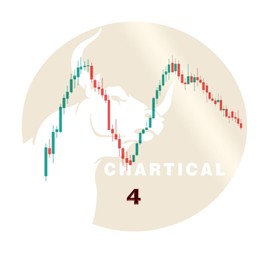
For sell trades, the logic is the same.
If the angle decreases, it means the effective sellers in the market are no longer committing their capital to selling and are gradually becoming lighter and weaker. When buyers enter the market, they are much stronger than the traders following the trend. Therefore, upon observing the first sign of a shift toward buying orders, the trader can execute a buy trade.
Conversely, if in a downtrend the downward angle increases, unlike the previous case where one should not look for buy trades, the trader should look for sell opportunities once the price reaches a higher level. By using this technique, when market changes occur before an extension forms and even while the price is still in choppy movement, the trader can detect the market direction early—after the next leg forms—and execute a sell trade at the first observable signal, ahead of many other traders.
In general, according to the Chartical Jabal Ameli method, whenever the upward step angles increase and steepen, it confirms a buy direction. Traders should therefore look for opportunities to enter buy trades. If any tool or method signals a sell in this situation, it should be ignored, as entering would be unprofessional and a potential trap.
Similarly, in a downtrend, as the price legs’ downward angle increases, the trader should look for sell opportunities, ignoring any signals for buy trades because these may be traps.
Trend Rules
Importance of Trend Rules
A professional trader must trade with the trend and remain within it. Avoiding emotional, impulsive, or uninformed decisions depends on understanding trend rules.
Think of it this way: if you want to work with someone or establish a friendship, without knowing their personality, even if both of you are the most suitable people, conflicts may arise. You must understand what the other person likes and dislikes, and avoid behaviors that might upset them. Similarly, understanding trend rules prevents unintended mistakes in trading.
Trend Laws
In the Chartical Jabal Ameli method, there are two main trend laws:
- Law of Trend Continuation
- Law of Trend Non-Continuation
As shown in the illustration, it is very important for the trader to know how many candlesticks form a trend and how to follow it. The market has a lower framework and an upper framework, which are the key edges that the trader focuses on.
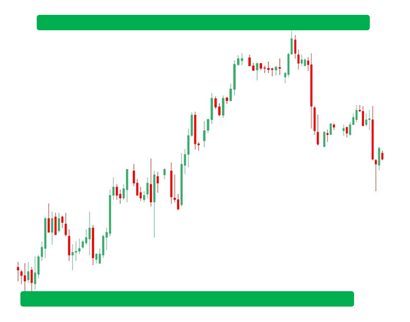
Law of Trend Continuation
When the price starts moving from one level toward another, it continues its movement until it reaches the opposite level. For example:
- If the price begins moving from the lower edge, it continues upward until it reaches the upper edge.
- Similarly, if the movement starts from the upper edge, the price continues downward until it reaches the lower edge.
This is the first law of trends.
Law of Trend Non-Continuation
The second law, called the Law of Trend Non-Continuation, is based on the first law and states that the price will not reverse or change trend unless it reaches the opposite level.
- The main condition for a trend change under this law is that the price must reach the opposite level. Only after this can the trader look for sell opportunities.
There is another scenario in the Law of Trend Non-Continuation:
- The price can change trend without reaching the opposite level only if an extension and a correction (carcktion) occur in the opposite direction.
- In this case, it can be concluded that the trend has shifted from upward to downward (or vice versa).
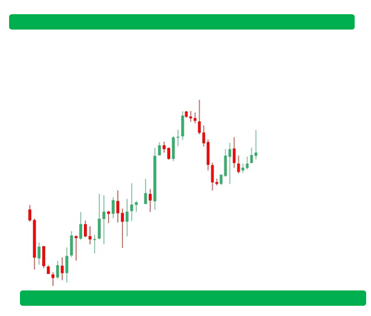
For Downtrends
The same rules apply to downward trends. If the price starts falling from the upper level, under no circumstances can the trader assume the downtrend is over or be certain that the price will not reach the opposite level—unless an upward extension followed by a correction occurs. Only then can it be said that the trend has changed, and the trader may start looking for buy opportunities.
Summary of Trend Rules
From this section, we learn that a trader must trade with the trend. To avoid emotional or impulsive decisions, the trader should follow the trend rules, which include:
- Law of Trend Continuation – Once the price starts moving from one level to another, it continues until it reaches the opposite level.
- Law of Trend Non-Continuation – The price will not reverse or change trend unless it reaches the opposite level. The only exception is when an extension and a correction occur in the opposite direction, which indicates a trend reversal.
Market Profitability Coefficient
In classical economics, there is a concept called the profitability coefficient of a stock, which economists use to estimate the future profitability of a stock or trading symbol. Questions they aim to answer include:
- Will this stock be profitable or unprofitable in the future?
- If profitable, how fast will it generate returns?
- Is its growth rapid or slow?
- If its profitability decreases, is the decline accelerating, or is it a drop following a prior increase?
These questions are critical, and the underlying theory is complex with many variables.
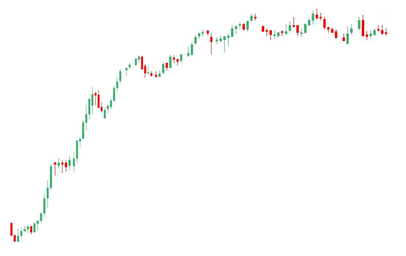
Example: Observing the Skew Coefficient in an Uptrend
Consider the chart above: there is an upward movement that initially had a good skew coefficient. At the start:
- Correction depths were low,
- Projections were long relative to the depths, and
- Step angles did not indicate weakness.
However, after a certain point, the price no longer moves upward as before. It becomes evident that:
- Depths are increasing,
- Distances (projections) are shortening, and
- Angles are flattening.
This subtly communicates to the trader that the active participants driving the trend (buyers in this case) no longer have strong financial or psychological persistence. They are continuing their buying activity slowly and passively. In other words, liquidity is visibly decreasing in the market.
Even if any pattern or indicator suggests a buy opportunity here, a professional trader would not take the trade. One of the characteristics of an efficient market is that the price itself reflects everything happening behind the scenes. Here, the decreasing skew coefficient signals that market profitability is diminishing, warning the trader not to seek buying opportunities.
Application to Downtrends
The same logic applies to downward movements:
- As downward steps increase in size and angles steepen, projections grow, corrections decrease, and the skew coefficient rises—indicating a strong downtrend.
- Conversely, when depths increase, distances shorten, and angles flatten, the skew coefficient decreases, signaling a weakening downtrend.
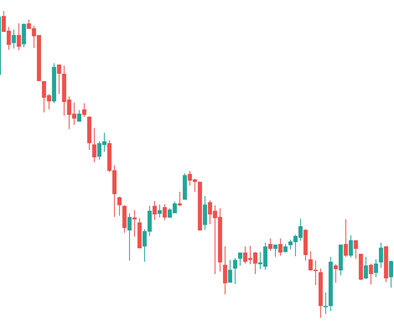
Drawing Skew Coefficient Lines
In downward movements and trends, the trader should:
- Draw below the price the areas where the skew coefficient is decreasing,
- Draw above the price the areas where the skew coefficient is increasing.
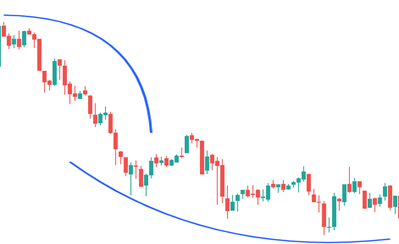
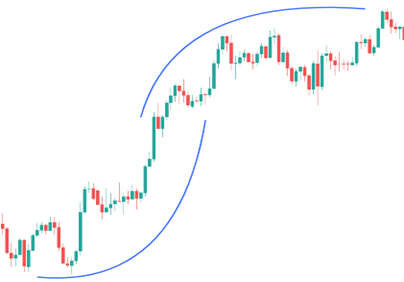
Remember:
Projection, depth, and slope may interact and show changes that lead to either an increase or decrease in skew. Therefore, to observe skew, it is not necessary for all three to occur simultaneously; even one or two can provide the trader with useful alerts. However, if all three occur together, the signal is much stronger.
For trading in a high-potential setup, the skew should be increasing. If the trader finds a position where the skew is decreasing and still enters, they are effectively committing time and capital to a market where the price moves slowly and riskily, rather than to a trade with lower risk and higher potential.
Price Movement
Whether in the form of an extension or a correction, the price in the market moves in legs. The trader needs to answer key questions:
- How much and in what manner should the correction or extension continue?
- Has the extension or correction completed its expected move?
- Has it moved more than the average of its previous movement?
To answer these, the trader examines movements — the actual price actions.
Movement (Moovement)
In the Chartical Jabal Ameli method, movements that create the legs of the market can provide valid clues for entering trades.
- Definition: The movement is the amount the price has previously traveled in its corresponding leg.
As shown in the illustration, there is an extension and a correction. This extension has a movement (the distance the leg has traveled). Therefore, for the next leg, it is expected that the price will move approximately the same amount as the previous movement.
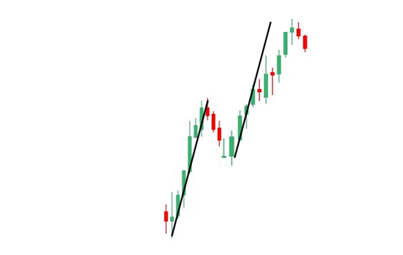
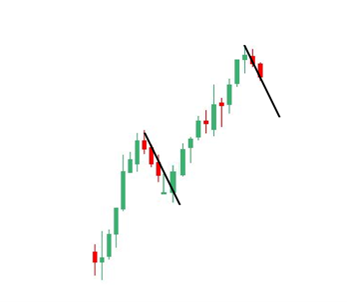
Application of Movements (Moovement)
First, it should be noted that often traders see one or two candles moving against their profit direction and mistakenly assume that the market will no longer continue in the trend direction. They think the market is stagnant and about to reverse, so they quickly close their positions, only to see the price resume its movement in the original trend, causing them to miss profits.
Therefore, as long as the market price has not completed its movement (moovement), the trader should not consider one or two candles as the end of the move and wait for a reversal — unless that behavior is meaningful. For example, if the candles form near a tension level or a swing point, and one or two candles stall, this may indicate that the price is losing momentum and could potentially stop.
Probability Insight from Repetition
Another use of moovement is based on the principle that the more often an event occurs, the less likely it is to occur again soon, and conversely, if an event happens rarely, the probability of its repetition is higher.
Example:
Imagine a city where a major earthquake occurs every 100 years. If only 20 years have passed since the last one, the residents and authorities are not highly concerned, knowing another major earthquake is unlikely for another ~80 years. But if 120–130 years have passed since the last quake, everyone would live with constant anxiety, knowing a major quake could occur at any moment.
Similarly, in trading, rare market movements or setups may have a higher probability of repeating, while frequent movements are less likely to repeat immediately.
Moovement and Trade Timing
Contrary to the view that markets are purely probabilistic or random, the Chartical Jabal Ameli method holds that movements are not entirely random. If the clues are accurate, setups can be identified in advance.
- When a trading opportunity arises after an extension and a correction, measuring the moovement allows the trader to estimate the likely continuation of the next price move.
- If the entry point is reached before most of the moovement has occurred, the probability that the move will continue is high, making it a low-risk trade.
- If, however, the price has already completed 50% of the expected moovement, entering at this point is suboptimal and high-risk.
In other words:
- Less moovement used: Lower-risk, higher-confidence trade — can even be taken with a larger position.
- More moovement used: Higher-risk trade.
Profit Taking in Chartical Jabal Ameli
In this method, there is no fixed profit target. Just as having a stop-loss is essential for institutional traders, setting a fixed profit target is considered unprofessional and counterproductive.
- If the price moves towards the expected profit range and completes its moovement, the trader may take partial profits.
- This is not a formal profit target, but rather a prudent action based on the likelihood that the price may stop moving further.
- This stopping point could be just a correction or an extension, so the trader should take N% of the position at the peak and hold the rest for potential further movement.
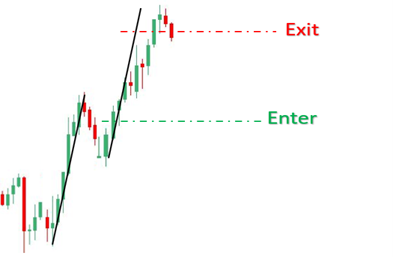
Price Movements (Moovement) as a Core Principle
One of the most widely used principles in the Chartical Jabal Ameli method is the utilization of price movements (moovement).
- This allows the trader to easily gauge the current market participants’ ability to move the price.
- In other words, it shows how much buyers or sellers can move the price during each push in the market.
- This provides a good moving average for the trader, helping to set realistic expectations about the market.
- Based on this, the trader can determine ideal entry points and know when to partially exit or take profits.
Market Cycles
The market never moves in a single, uniform way. It has different states or cycles, each with distinct characteristics. In this section, we describe three of the most frequently observed market cycles.
In the Chartical Jabal Ameli method, before a new cycle begins, the trader can detect it faster than others.
- This early detection allows the trader to capitalize on the new cycle without additional costs.
- By understanding the types of market behavior and Chartical clues, the trader can maximize potential profits instead of just exiting with small gains.
Spike Cycle
The first cycle is called the Spike Cycle.
- A spike is a type of leg (or movement segment).
- Normally, powerful legs become extensions, while weaker legs are called corrections (carcations).
- However, some legs are not extensions; they are spikes.
Characteristics of a Spike:
- Stronger than normal extensions — signs of market strength are far more pronounced.
- Begins with small candles, then accelerates quickly, with candle sizes rapidly increasing.
- Exhibits a steeper slope than other market moves.
- Always occurs at the beginning of a trend, whether upward or downward.
- Appears only at market edges:
- Upper edges of downtrends
- Lower edges of uptrends
- Never forms in the middle of the market
Because spikes are created by institutional traders and involve high liquidity, they show larger moovement compared to normal market legs.
- A spike is essentially the very strong first leg of a new trend, and it sets the stage for subsequent market movements.
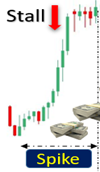
Spikes and Institutional Traders
Based on the previous discussion, spikes are created by institutional traders, and it’s important to note that major traders never enter the market in the middle of a trend.
- Therefore, if a spike-like move is observed mid-trend, it is simply a strong extension.
- Sometimes this can happen due to emotions or news events, so the trader must not fall into a trap and should consider other confirming signals before making a decision.
Types of Corrections
In earlier sections, we discussed that in financial markets, there are three main types of corrections:
- Pullback – medium strength
- Complex pullback – weakest
- Stall – strongest
- In extension legs, a normal extension has moderate strength but is still considered powerful.
- Spikes, however, are much stronger than ordinary extensions.
After a spike occurs, when the correction begins:
- The correction should usually appear as a stall.
- This is because the capital behind the spike is significant, so when price corrects, it cannot fall back to previous levels.
- Typically, the correction can only retrace up to 15%, forming a stall-type correction, which is considered the first market cycle.
Recognizing Spikes Early
A trader can detect a spike in its early stages by observing:
- Decreasing choulgi coefficient (market momentum/efficiency)
- Decreasing projection
- Lack of continuation power
- Increasing depths
- Decreasing price step slopes
Once these conditions are identified, the trader can enter a buy position even before the spike and stall fully form.
Trend Cycle
The first market cycle is the spike and stall. The second cycle is the trend cycle.
- The trend cycle is a phase recognized by most professional traders, where they begin entering new positions.
- From this point, the market moves in trend-based movements.
- Trend lines start forming only after traders notice higher highs and higher lows.
Example:
- Some traders may interpret an indicator phase change as the start of a trend and enter a trade, believing it is the optimal entry point because it coincides with touches of channels, trend lines, or Andrews’ Pitchforks.
- However, they may end up in a choppy or losing trade, mistakenly attributing the failure to bad luck or external factors rather than insufficient market knowledge.
- By the time such trend signals appear, most traders want to join, but these points, although potentially profitable, are no longer the golden entry points for a professional Chartical trader.
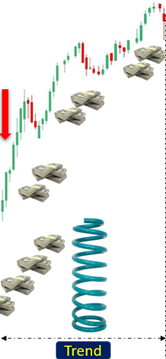
Range Cycle
The third market cycle is the range cycle, which most often appears as a choppy range.
- In this phase, institutional traders have already taken sufficient profits from the market, and they no longer create significant movements at the end of corrections that professional traders could benefit from.
- Professional traders have also already captured their profits and are well aware of the signs of trend exhaustion.
However, traders who are waiting for additional confirmations, or those who prefer to wait for a trend to form across three timeframes, from lower to higher, realize it too late.
- Their capital is limited, proportional to their knowledge and skill, and thus it cannot influence the market enough to create a significant uptrend or downtrend.
- As a result, the price immediately enters a range.
- At the same time, previous traders often partially take profits or stop entering new positions in these zones.
- Due to the small amounts of money held by retail traders, the market lacks strong movement in this phase.
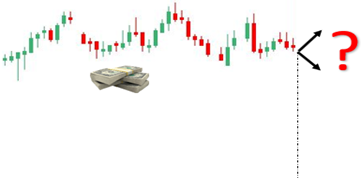
The market never moves in a single uniform way; it does not follow just one pattern and exhibits various behaviors. The three most recurring market states are the spike cycle, the trend cycle, and the range cycle.
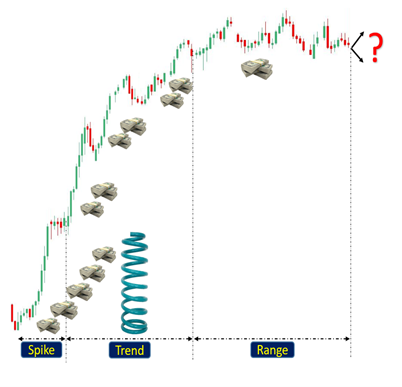
Market Cycles
- The spike cycle occurs when there is strong participation and liquidity from institutional traders, creating powerful extensions. It begins with small candles that gradually grow larger and is always present at the start of a new movement or trend.
- The trend cycle forms in a range where the trend has already begun. Steps (gaps) and pullbacks follow each other, and any trader, using any method, may see it as a good entry point. However, most enter exhaustive trades, especially if the market moves have repeated multiple times.
- The range cycle typically occurs as a choppy range, which happens when institutional traders are no longer actively influencing the market.
Contrarian Theory (Tory-e Khilaf)
In the Jabal Ameli Chartical Method, a trader should focus on weaknesses, pullbacks, and candle changes to identify when a trend is losing strength. This can be detected through angle changes, depth changes, distance changes, or changes in market convexity. Identifying weakness in pullbacks is crucial to distinguish whether it is a simple pullback or a complex pullback.
It is impossible to read the hands of institutional traders—to know what trades banks are making, where stops will accumulate, or where major entries occur—without tools like footprint strategies, as access to real volume data and order books is required.
Instead, attention should be paid to retail traders, or “trapped traders,” because professional traders spend considerable time and money on education, making their moves hard to predict. In contrast, the behavior of trapped traders is unprofessional and easy to anticipate.
Contrarian principle (Burhan-e-Khilaf):
- To succeed, act opposite to the majority.
- Around 90% of market traders are trapped, meaning their trades are in loss. Not all of these 90% continuously lose, and not all are retail traders—some are institutions that trap each other. The liquidity of trapped traders may only account for ~10% of the market, while institutional liquidity can reach ~70%. Institutions aim for growing capital, so strategies that work for retail traders are irrelevant to them.
Thus, a professional trader should:
- Identify who makes up the majority of the market.
- Determine if they are trapped traders.
- Trade against them, leveraging the behavior of institutional traders who ultimately dominate due to greater capital and persistence.
Shepard’s Illusion Theory
Shepard’s theory illustrates that perception may be misleading. For example, two tables may appear different in size at first glance, but measurement shows they are actually equal, demonstrating that what we see may not always reflect reality.
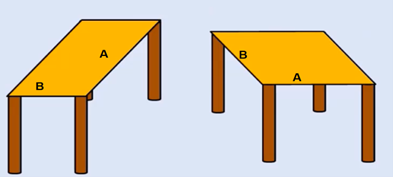
So you can see how easily our eyes and mind can be deceived.
This time, pay attention to the image below.
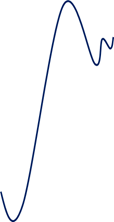
As you can see, an inexperienced trader easily falls into the market trap in such situations. To understand whether this large movement in price is an extension, the correction that follows it is very important. As shown in the image, at the end of a step, it might appear that there is just a small move and a correction, but upon closer inspection, this step itself is actually the correction of a larger movement. Here, the trader can determine where the market liquidity is and wait for a confirmation candle and an entry point in the main direction, in other words, follow the large market players.
Note that paying attention to these subtle and sensitive points can play a very important role in a trader’s success.
Best Time Frame
There are no restrictions for using the Jabal Ameli Chartical method, and traders can apply this method in any time frame.
Four Criteria for Choosing a Time Frame
In the Jabal Ameli Chartical method, four criteria are considered to help traders select their best trading time frame.
Criterion 1: Based on Market Liquidity
The higher the market liquidity, the better the time frame will be. This time frame can be 1 minute, 5 minutes, 15 minutes, or even weekly, monthly, or daily. In the core of market trading, it does not matter which time frame a trader observes. The market core only receives traders’ orders and places them in the last best price queue until transactions are executed. In fact, a time frame is just a temporal segmentation of the chart—not more than that. Trading orders continuously reach the market core and are simply divided into the selected time intervals for observation.
It is a fact that, for various reasons, larger groups of traders often focus on a specific time frame. That time frame, based on the clues it provides to the trader, becomes the one in which the most trading orders are issued and executed.
Criterion 2: Capital Amount
The higher the time frame a trader chooses, the more capital they need, because stop-losses in pips or percentages will be larger. Thus, the trader must have enough capital to sustain and utilize these stop-loss levels. Therefore, the next consideration is the trader’s capital: the greater the capital, the more freedom the trader has to choose higher time frames.

Criterion 3: Trader’s Personality Type
Some traders can manage a larger number of simultaneous trades, while others cannot. For example, a trader might be able to handle seven open trades simultaneously without emotional or psychological impact, whereas another trader might become stressed or excited with only two or three trades.
Similarly, the capacity to handle ongoing trades varies among traders. Some may require their trades to be resolved within one or two days, others within a few hours, and some may have no problem holding trades for several weeks. Therefore, based on profit and loss, each trader’s tolerance for trade duration and the mental or temporal capacity differs.
Consequently, a trader must find the time frame that suits their personality. There is no universal formula for this because people’s risk aversion, loss aversion, risk tolerance, and ability to manage trades vary. The trader should observe which time frames allow for comfortable management of trades and outcomes and consistently use those.
Criterion 4: Based on Organizational Traders’ Time Frame
Organizational traders, due to their long-term goals in market making and liquidity provision, help in better price discovery and typically observe prices on a daily basis. This also considers banking and interbank settlements and other technical trading issues, or even risk management in exchanges, banks, and insurance industries. Thus, they tend to use daily time frames.
Following organizational traders allows an individual to see more stable and analyzable trends in the market, leading to calmer and more confident trading.
Summary of the Four Criteria for Selecting the Best Trading Time Frame:
- Market liquidity: The higher the liquidity, the better the time frame.
- Trader’s capital: More capital allows choosing higher time frames.
- Trader’s personality: Risk tolerance and psychological capacity vary among traders.
- Organizational traders’ time frame: Following organizational traders allows more stable, analyzable trends.
Timing in Trading
The first issue traders must consider is timing. This has multiple aspects, which we will review here.
To trade successfully, a trader must ensure that they are in their best physical, psychological, and environmental state. For example, if someone wakes up feeling lethargic or physically unwell, they should not trade that day. While markets are always accessible via laptops and the internet, mere availability does not mean one should trade without readiness.
Similarly, traders should avoid trading when market volatility may spike unexpectedly, such as before elections, holidays, or during times when major institutions are inactive. For instance, trading EUR/USD while European and US banks are closed would result in little meaningful market movement.
Entry Edge
In the Jabal Ameli Chartical method, trades are not based on setups. Traders do not wait for a specific price pattern to appear; each market opportunity is unique, like a fingerprint. Waiting for a setup can cause the trader to miss many opportunities. Instead, traders must understand the “language of price” and recognize it.
Identifying the Entry Edge
The entry edge is recognized whenever trader behavior changes and a strong movement is about to occur, whether it’s a single step or a full trend. Traders should use specific techniques to detect the formation of candles and the shift in order flow. Once a market opportunity is identified, the trader waits for the first clear sign that previous trends have ended and that new, significant money is entering a specific direction, and then enters the trade.
Entering a Trade
- For buy positions, the trader should wait for a candle to close in the upper third of its range before buying.
- For sell positions, entry is allowed as soon as the first candle forms in the lower third of its range, but only at the specific price level where the change in order flow occurs.
Using the Entry Edge
When entering a buy trade, if the candle closes in the upper third, the trader can place an order. However, they must leave a buffer equal to twice the spread above the high of that candle to avoid slippage, whether placing a limit or market order.
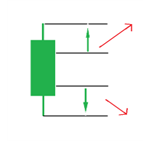
For entering short trades, the process is similar. That is, after a bearish candle forms in the lower third of the chosen price range, the trader can enter below that candle, leaving a buffer of approximately twice the spread.
As we discussed in previous sections regarding tension zones, these levels are areas, not single precise numbers.
Take a look at the image below:
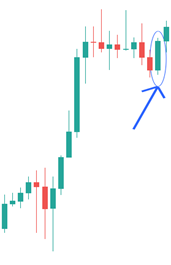
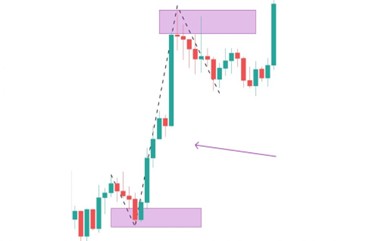
Here, there is a candle highlighted with a circle. We want to zoom into lower timeframes to examine what the concepts discussed earlier mean on a more detailed level and to analyze the movements of a single candle more precisely.
At the area corresponding to the candle’s open, the price initially moved downwards, creating a lower shadow, then moved upwards, partially retraced enough to form an upper shadow, and finally the candle closed.
The reason a trader leaves some space above the high of a candle is to define a range where they are confident that enough long orders have been executed to push the price higher and that price is now consolidating.
With this accumulation of trading orders, the price moves rapidly to worse and higher levels and continues upward. To ensure enough orders are gathered—whether they are buy orders closing short positions (i.e., traders with stop losses above) or new buy entries from traders seeing a swing in lower timeframes—the trader leaves enough room to ensure the price moves sufficiently to activate the flow of orders.
For downward moves, the process is exactly the same. When a trader looks for sell opportunities, and a candle confirms the order flow change (entry edge), they enter a short position slightly below the candle low, either via sell stop or sell-to-market. Enough short trades must occur to push the price lower, combining with other traders’ orders waiting for a break of the previous low or stop-losses from long trades in lower timeframes. This creates a springboard for strong price movement and prevents capital from being tied up unnecessarily.
This ensures that the entry point occurs where the maximum density of trading orders has been activated. At this point, it is also the last price for major traders—beyond this, further entries are no longer cost-effective for them. Hence, this is considered the last price of large traders, and any new entry is only justified until this level.
We’ve learned that a professional trader does not need a specific setup to enter trades. A Chartical trader is expected to interpret market clues and make the best decision in the moment. Remember, order accumulation should also be used for exiting trades or managing them.
Stop Loss
In the Jabal Ameli Chartical method, a stop-loss is critical. A trader without a defined stop-loss is acting recklessly. A professional trader must set a range for the worst-case scenario, both financially and psychologically, so that the market cannot dictate the outcome for their entire capital.
Definition of Stop Loss:
- The stop-loss represents the maximum financial and psychological cost a trader is willing to accept for a trade.
- It should not cause extreme stress, anger, or fear, nor be so high that it erases previous profits or a significant portion of initial capital. Setting a stop-loss helps the trader manage costs in the market.
Placement of Stop Loss:
Technically, a stop-loss should be set at a point where the price has not yet reached, but if it does, it indicates that the trade is no longer favorable. For example, if the price hits this point, it may continue against the trader’s position.
- For a buy trade, the stop-loss is set where there is a high density of sell orders—either short or sell-to-cover. If the price reaches this zone, the combined orders will create a strong downward movement, leaving no hope for a rebound.
- For a short trade, the stop-loss is set where there is a high density of buy orders, either long or buy-to-cover. If the price hits this level, a strong upward movement will occur, nullifying the short position.
As shown in the example, for a continuation trade, if a trader enters a buy, the stop-loss is set at the point with maximum sell and sell-to-cover orders. If the price returns there, the high concentration of orders will push the price sharply downward.
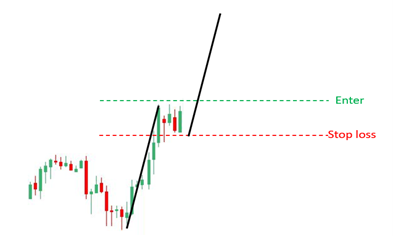
For sell trades, the process is the same. Imagine the price has moved upward and the trader intends to enter a short trade at the upper edge of the market. Naturally, the stop-loss is placed at the point shown in the image, which is the area where a sufficient number of long and buy-to-cover orders are concentrated.
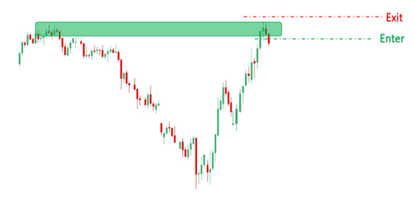
- Long trades are for those traders who operate based on breakouts of levels.
- Buy-to-cover orders belong to traders who have taken short positions and place buy-to-cover as their stop-loss at that level.
We understand that the stop-loss refers to the maximum financial or psychological cost a trader is willing to bear for a trade.
In the Chartical Jabal Ameli method, a trader should place a realistic stop-loss at a point where, if the price reaches it, it will likely not reverse. In other words, the stop-loss represents the last chance for the trade to recover, or the final barrier before the price can continue moving against the trader’s position.
It is crucial to measure the stop-loss accurately before entering a trade, because the trader must determine the appropriate position size based on the potential loss. After entering a trade, the trader is allowed only to limit losses, never to increase them. Furthermore, when choosing a stop-loss, the distance should be twice the spread from the swing or candle in question.
Risk-to-Reward (R:R)
The concept of risk-to-reward is often mentioned on social media or in trading articles. However, relying solely on R:R can be misleading.
If a trader uses realistic and professional trading systems, there is effectively no risk. Using analytical methods alone (as Eugene Fama suggested) tends to reduce the success rate and increases perceived risk. But when a trader acts as a professional trader using proper trading methods, the market risk is practically eliminated.
For example, many people think buying a lottery ticket involves very little risk because they pay a small amount for a chance at a large reward. In reality, the risk is extremely high because the probability of winning is very low. Risk is not determined by cost, but by the likelihood of success: higher probability = lower risk; lower probability = higher risk.
In the Chartical Jabal Ameli method, the minimum probability of a successful trade is 70–75%, and any remaining 25–30% is managed through the exit strategy.
Even if a trade results in a loss, it is considered a normal cost, not a failure. Losses are part of all business activities, just as costs are. The market itself does not create risk, because the probability of success is high, and losses represent manageable costs.
Many traders skip trades due to “unfavorable” R:R, only to see prices move strongly in the profitable direction later. Conversely, trades with seemingly favorable R:R sometimes result in losses.
Thus, traders should set a stop-loss to manage costs, but they should not rely on R:R as a measure for trade selection. Instead, the trader should focus on entry signals and high-probability opportunities.
Take-Profit Principles
In the Chartical Jabal Ameli method, there is no guaranteed take-profit level, just as there is no guaranteed stop-loss. If a stop-loss is hit immediately after entering, the trade was not justified.
Experienced traders focus on making the best decisions in real-time rather than predicting the future. They observe economic conditions, price movements, order flow, and which participants are influencing the market. They enter trades based on current market strength, trusting that major participants are acting in a particular direction. This defines the trend.
Setting a take-profit is only reasonable in three cases:
- Psychological or behavioral guidance: If a trader’s mentor or psychologist recommends limited take-profits temporarily. The trader exits fully at these points for a short time.
- Aggressive incentive money management system: Traders at an advanced level may follow a programmed risk/reward system for compounding profits.
- Range-bound markets: When the market has clear support and resistance, traders can exit at these levels. Partial exits can be taken if signs indicate potential breakouts or trend continuation.
Outside these scenarios, placing a take-profit is considered unwise. Traders should remain in trades as long as order flow supports their position, exiting only when momentum weakens or leading participants start cashing out.
Exit Strategy
The exit strategy is more important than the entry strategy. Although both are essential, adherence to exit rules is crucial because the market is uncertain.
In Chartical Jabal Ameli:
- The entry strategy raises the probability of success to 70–75% (and sometimes up to 95%).
- The exit strategy minimizes losses and manages costs efficiently.
Example: Entering a trade is like preparing for a child: extensive preparation ensures a high probability of success, but the real responsibility starts after the child is born. Similarly, traders must manage their trades actively, responding to market changes rather than relying on a pre-set stop or take-profit.
Definition: Any pre-determined plan a trader follows consistently—based on experience or guidance—is considered an exit strategy.
Chartical Jabal Ameli Exit Rules
Important: All rules are described for long trades; short trades are reversed. For example, a “top-third candle” in a long trade corresponds to a “bottom-third candle” in a short trade.
- After entering a continuation trade, wait for the second candle in the trade direction. Once each candle closes in the top third, the trader may move the stop-loss below that candle.
- Continue moving the stop-loss with each subsequent top-third closing candle until momentum is exhausted or a tension level is reached.
- Do nothing if a candle closes weakly, in the middle third, or reverses. Only strong top-third closures trigger stop-loss adjustments.
This method ensures active trade management, protecting profits while allowing the trade to reach its potential.

2- After reaching a tension level or completing a momentum move, the trader should take partial profits and move the stop-loss slightly below 50% of the distance already traveled. From that point onward, the trader should adjust the stop-loss below each subsequent swing that forms in the current trend.
In the image below, you can see how the stop-loss continues to be trailed until the final exit from the trade, allowing the trader to capture maximum profit.

Note: A professional trader only moves their stop-loss after being confident that a price correction has ended and the market is ready to resume in the direction of the trend. Otherwise, there is a high probability of being stopped out, after which the price may continue in the anticipated direction.
3- In reversal trades, the approach should be similar to continuation trades, but with one small yet impactful difference: in reversals, the price should not be allowed to stagnate for long. As soon as a weakness in the price reversal is observed, the trader should exit the trade immediately, as it indicates the market lacks the strength to continue the reversal.
We have seen that an exit strategy is far more critical for a trader than an entry strategy. Even the best trades, if not managed correctly, cannot realize their full potential. With proper exit management, the trader can maximize profits and, at the same time, minimize losses—even in cases of incorrect entry or sudden market news causing reversals.
As mentioned, in the Chartical Jabal Ameli method, the probability of successful trades ranges between 75% and 95%. However, to achieve this high success rate and minimize losses, the trader must always seek ways to limit losses, which is made possible through a proper exit strategy.
Remember that a well-implemented exit strategy can simultaneously limit losses and expand profits. It helps prevent premature exits driven by fear or uncertainty. A trade may have high profit potential, but after entry, price movements may not continue as expected. Therefore, the trader must be prepared to manage the trade optimally to their advantage.
Types of Exits
Given the efficient nature of financial markets, where prices can move against expectations at any moment, a trader must exit trades in stages according to the Chartical Jabal Ameli method. This section explains both single-stage and multi-stage exits.
Single-Stage Exit
In a single-stage exit, the trader closes the entire trade at once based on the signals and cues previously discussed. This can occur in profit, loss, or break-even zones. When the trader determines that the price cannot move further in their favor, the trade should be fully closed.
For example, in range-bound areas, once signals indicate that the price is likely to reverse after reaching the opposite level, there is no reason to leave the trade open. To maximize profits, the trader should close the trade completely at that point.
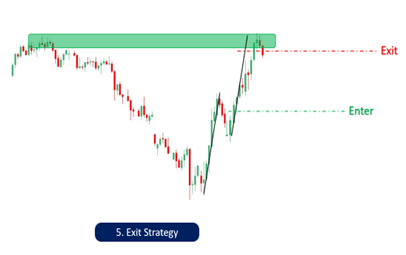
Multi-Stage Exit
In a multi-stage exit, when a trend is established and the price continues to advance in a specific direction, the trader is allowed to close part of the trade at the highest profit level reached at that moment, being aware of the efficient nature of the markets.
Identifying the Optimal Exit Point
When the trader is in a trend, they can enter a trade after observing strength in one side of the market and weakness in the opposite side. After entering, to roughly estimate the next potential market move, the trader should use the movement (momentum) method, meaning the price is likely to move approximately the same distance as its previous movement in the same direction.
By combining this with the importance of tension levels and other market cues, the trader can assemble the “puzzle pieces” to determine the best time to close part of the trade.
Note: After exiting part of the position, the trader should move the stop-loss of the remaining portion slightly beyond 50% of the movement completed and wait for the correction to end before taking further action.
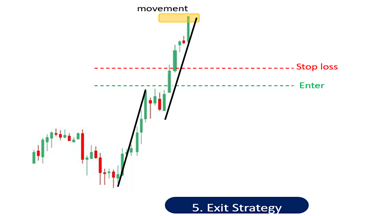
Even though a trade is in trend and appears to behave logically until the end, remember that a professional trader does not act like a gambler. They always consider the highest probability outcome.
Maximum Profit
A professional trader simply follows the market, meaning they stay with the trade as long as the price shows signs of strength to continue in that direction. When the price reaches a critical zone or shows signs of weakness, the trader closes part of the position, not the entire trade. The portion closed depends on the importance of that point and the current market conditions, while also taking into account that traders’ risk tolerance varies.
But the process does not end there. After closing part of the position, the trader must continue observing price behavior until the expected correction ends and a new entry opportunity arises. If the market allows a new entry, the trader can enter again because they already have some profit accumulated from the previous trade. Importantly, this profit is no longer a cost borne by the trader, as the market has effectively “paid” it.
In other words, because the trader did not close the entire position and only partially exited, the remaining portion that is still open and profitable can be considered as potential risk for the second trade. Even if the new trade fails, the amount at risk is covered by the remaining profit from the previous position. Therefore, while a small cost may occur if the new trade fails, it is not coming directly from the trader’s own capital.
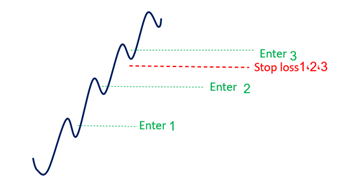
In this way, after exiting a trade, the trader should lock in a portion of the profit for themselves and use part of the remaining profit to seek further gains. This process continues as long as strength and weakness in the market remain observable in the trader’s favor, with stop losses moved behind each new swing.
We have become familiar with two exit models in the Chartical Jabal Ameli method:
- Single-stage exit – in this model, the trader closes the entire trade volume at the first point they identify as the best exit opportunity.
- Multi-stage exit – in this approach, the trader gradually exits the trade as the price continues along the market trend, depending on their personal trading style and psychology.
For example, suppose you have entered a trade and the first market extension occurs. Mentally, it may feel easier to close around 50% of the trade volume at this stage, because the probability of the price reaching the first extension is much higher than forming a second or third extension. Therefore, since this stage has the highest probability, the trader takes the largest portion of profit.
For the second extension, the trader might close 30% of the remaining position, and for the third extension, the final 20%. In other words, as the probability of further price advancement decreases, the trader locks in an increasingly smaller portion of the remaining position, managing risk and profit in a probabilistic way.
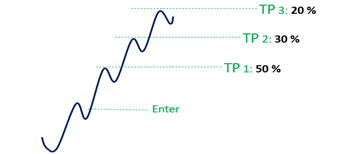
There is a principle in statistics and probability which states that the more an event occurs, the higher the probability that it will not occur again, and vice versa. Similarly, with the age of living beings, the older an organism becomes, the higher the probability of death compared to its early life stages.
In the Chartical Jabal Ameli method, the trend behaves in the same way. That is, at the beginning of a trend, the probability that the price will continue moving in the same direction is very high, but as it goes through multiple extensions, the probability of continuation decreases.
Therefore, traders who aim to maximize guaranteed profits tend to close the largest portion of their trade in the first extensions. However, for some other traders, it does not matter, and they treat all market movements equally. In this case, they divide their capital into three parts:
- 30% in the first extension
- 30% in the second extension
- 30% in the third extension
The remaining 10% is left open, so if the price continues, it can compensate for part of the costs they have already incurred in the market.
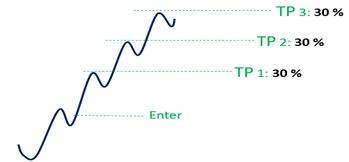
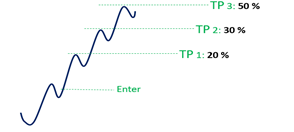
There is a principle in statistics and probability which states that the more often an event occurs, the greater the probability that it will not happen again, and vice versa. The same applies to the age of living beings: the older an organism gets, the higher the probability of death compared to its early stages of life.
In the Chartical Jabal Ameli method, trends follow a similar principle. At the beginning of a trend, the probability that the price will continue its movement is much higher. However, after the trend passes through several extensions, the probability of continuation decreases.
Consequently, traders who aim to maximize guaranteed profits tend to close the largest portion of their trade in the first extensions.
For other traders, all market movements are considered equal. In this case, they divide their capital into three parts:
- 30% in the first extension
- 30% in the second extension
- 30% in the third extension
The remaining 10% is left open, so that if the price continues, it can offset part of the costs they have incurred in the market.
These mental and cognitive aspects cannot be standardized in a way that a single version or method could be applied by all traders. Just as there is no fixed prescription for personal or psychological behavior, there is no universal formula for trading behavior or market interaction. Each trader must identify their own appropriate approach, which can be achieved through maintaining a trading journal.
Exit with Stop-Loss Management
Given the efficiency of financial markets, it must be considered that price may not move according to the trader’s expectations after entering a trade, may move gradually, or may move into a loss zone.
- If the price moves gradually and spans three candles, and the price ends up only a few pips higher or lower, the trader should close the trade on the third candle.
- Entry should only occur when there is a broad alignment of market orders in favor of the trader’s position. For example, if a trader has entered a long trade at a point with many long and buy-to-cover orders, identifying this optimal entry point usually propels the price toward profit. If this does not happen, it indicates either a misjudged entry point or that the favorable market sentiment has dissipated.
According to the Chartical Jabal Ameli method:
- If the trend-building traders are not present in the market, it is illogical for a Chartical trader to remain in the trade. The trade should be immediately closed.
- If the price moves into a loss area, contrary to expectations, but is still within 50% of the distance between entry and stop-loss, the trade can remain open as long as the candle does not close in the lower third.
- If a candle closes in the lower third, the next candle is likely to move further against the trader, and the stop-loss must be accepted.
- While the candle has not closed in the lower third, the trade can remain within the first 50% of the distance from entry to stop-loss.
If the price moves toward profit, as illustrated below:
- In the first one to three candles, since the trader cannot know how the extension will progress—whether it starts small and gradually grows, starts large immediately, or is a single-candle move—the stop-loss must be managed carefully.
Thus, a professional trader in the initial candles should move the stop-loss candle by candle:
- Whenever a candle closes in the upper third (for a long trade), immediately move the stop-loss to the low of that candle.
- This process should be continuous, allowing the price to reach its movement target and potentially extend to the same magnitude as its prior move.
- At this stage, a portion of the trade can be partially closed for profit.
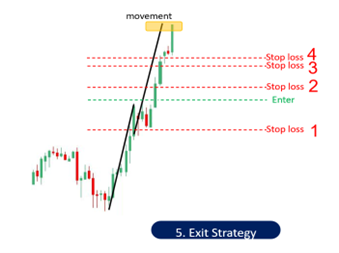
In this case, depending on the trader’s personality type, a portion of the trade can be closed for profit, and the stop-loss can be set at 50% of that move, allowing the remaining portion to continue if the price has momentum.
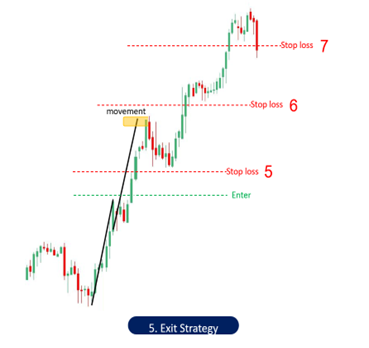
When the correction is complete and a new entry point emerges, the trader will take a new position and set the stop-loss according to the established rules, while also considering the stop-loss of the previous trade alongside the new one. This process should continue as long as the price does not show signs of inability to move further.
In managing trades with a stop-loss, the trader using stop-loss management techniques always aims to follow the price with minimal risk, keeping in mind that in the Chartical Jabal Ameli method, by assessing the psychological state of market participants based on the provided cues, the trader can make the best decisions in real time and accompany the market to maximize potential profits.
Chapter Four: Maintaining a Trading Journal
In the previous chapters, we learned how to identify a good trading opportunity in the market, and once such an opportunity arises, how to execute the trade effectively. After entering a trade and managing its exit, the next crucial step is to maintain a trading journal.
In the Chartical Jabal Ameli method, the trading journal is extremely important because it helps the trader understand the best actions they could have taken in the market and how they can improve their trading process. The trading journal is the most effective tool for managing trading activity, but using it properly requires specific methods.
Many traders have experienced the situation where they think: “If I hadn’t done this particular action in this month’s trades, or if I had acted differently, my results would have been much better.” They then attempt to adjust their trading style accordingly. Unfortunately, the expected outcome often does not materialize. Traders may implement new setups or settings and believe their trades will become profitable, only to see that results remain unsatisfactory. This happens because they fail to consider the statistical context: how many times did a particular outcome actually occur? Was it 100 out of 100 times, 100 out of 150, 100 out of 500, or even 100 out of 10,000? While observing 100 occurrences might seem significant, the proportion relative to the entire dataset is what truly matters, and decisions should not be made based solely on absolute numbers.
In trading, it is common to see traders attempt to increase profits or reduce losses by changing their methods. However, unless a trader has a comprehensive record of their own market behaviors, they cannot reliably predict outcomes based on assumptions alone.
How to Maintain a Trading Journal
Some traders think that keeping a trading journal simply means recording entry price, exit price, profit or loss, trade time, or the traded symbol. While this information is readily available in the trading platform’s history, the key is to record your own behaviors, because it is your actions and decisions that ultimately affect profitability—not the numerical values of price or time.
The image below illustrates this concept.
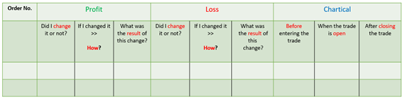
Example of Maintaining a Trading Journal
A trader should write the trade invoice number in the first cell of the journal and create a folder on their computer with the same number. At the moment of market entry, the trader takes a screenshot of their trading screen and saves it in that folder as “Image 1.” If they change their stop-loss during the trade, they should record how and why the stop-loss was adjusted in the next cell, along with the result of that change. Only through this meticulous recording can a trader, after executing numerous trades and over time, review their performance and determine whether their trading behaviors were correct. Any changes made will then be based on documented evidence rather than guesswork or emotions.
Similarly, traders should create columns in the journal for take-profit management, noting where and why targets were set, any adjustments, and the outcomes of these changes. In the emotions section, traders should record how they felt upon entering a trade: fear, doubt, obsession, or whether they were influenced by others’ opinions on social media. In the next cell, they should document their feelings while the trade is active and afterward, such as satisfaction, pride, or continued doubt. Recording all these emotional states helps determine if the trader would repeat the same trade under similar circumstances in the future.
A professional trader takes screenshots at every stage whenever they adjust stop-loss or take-profit levels and stores them in the same folder. This allows themselves, their coach, or any advisor to analyze the trades accurately, understanding the reasons behind each decision and the resulting emotional reactions. Without a complete journal, no one can effectively assist the trader, and any guidance provided may conflict with the trader’s natural behavior, leading to poor results.
Importance of a Trading Journal
Without documented trades, a trader cannot fully understand the behavioral or psychological causes of their mistakes. They may misinterpret their own behavior, making it impossible to inform a coach accurately. Additionally, without a journal, the trader may misapply strategies suggested by a coach, since they do not fully understand why those strategies work for them. Each trader has unique experiences, risk tolerance, and emotional responses, both in trading and personal life. Losses in one or two trades usually have minimal impact on experienced traders, but beginners may make emotion-driven decisions. A properly maintained journal allows repeated review from multiple angles. A coach reviewing the journal can determine whether losses were due to misidentified entry points, poor exit management, emotional reactions like FOMO, news influences, or other factors, and provide tailored guidance.
The journal helps traders understand that behaviors—not numbers—affect profitability.
Questions a Professional Trader Should Answer After Reviewing the Journal
For losing trades:
- Could losses have been limited?
- How could they have been limited through specific adjustments?
For profitable trades:
- Could profits have been higher?
- How could profits have been maximized through specific actions?
Traders must record their journal honestly and without exaggeration. This process should begin immediately after initiating a trade and continue through every action and emotional experience. The journal should then be reviewed periodically and any insights incorporated into the trading plan.
Trading Plan
In the Chartical Jabal Ameli method, all emotional and behavioral experiences are recorded. By reviewing past trades, a trader identifies profitable behaviors to internalize and determines which actions or omissions could have increased gains or reduced costs.
A trading plan defines a trader’s personal structure for trading. Trading is inherently subjective, so no single plan works for everyone. Each trader must act according to their own personality and risk profile, and the trading plan is derived from the journal.
Example Trading Plan
A student of the Chartical Jabal Ameli Academy provided the following unaltered plan:
- Stick to the plan. Regardless of others’ opinions or social media signals, trades must follow the plan.
- Read the plan daily before starting trading to maintain awareness of the intended approach.
- Focus on net results rather than individual trades. Losses are part of the process.
- Losing a profitable trade hurts more than entering a new trade. Manage exits carefully.
- Close half of positions and set to risk-free upon reaching the daily target; continue with remaining positions.
- Close all trades upon reaching weekly targets.
- After weekly goals are met, focus on education. Review past trades, identify strengths and weaknesses, and invest in personal growth.
- Continue this plan until the end of summer. Trading plans should be periodically updated, never treated as static.
Risk Management and Prerequisites
- Maximum risk per trade: 2% of account equity
- Simultaneous trades allowed: 2
- Maximum drawdown: 10% of total account stops all trading
- Daily target: 2% ± 1%
- Weekly target: 10% ± 5%
- Trading hours: 9:00–12:00 and 15:00–18:00
- Currency pairs: Major pairs + GBPJPY, GBPAUD
- Timeframe: 1 hour (H1)
- Stop-loss placement: at least 5 pips from swing or order flow candle
A trader must evaluate their psychological capacity to manage multiple positions simultaneously. If the maximum is two trades and both go negative, a loss of 4% may occur, which must be pre-considered.
If drawdown exceeds 10%, all trades are stopped. This rule stems from journal-based experience. Professional traders plan for every scenario to avoid emotional decisions.
Trade Entry Setup
- Enter trades in the direction of the higher timeframe.
- Near supply and demand levels: minimum of 8 checklist points must be met.
- Clearly define stop-loss and trade cost before entry.
- For breakout trades: only in the direction of the higher timeframe.
- If higher timeframe is sideways: trade only at the edges (support/resistance), avoid mid-range entries.
Trade Exit Rules
- Risk-free: trail stop candle by candle until stop-loss is risk-free in reversing positions.
- Near Take-Profit (TP): move stop-loss based on lower timeframe swing; trail according to candle strength.
- For buy trades: place stop-loss below the low of the strong candle near TP.
- For sell trades: same logic applies; weak candles do not justify adjusting stop-loss.
Conclusion
A professional Chartical trader must have:
- Pre-entry checklist
- Complete trading journal
- Trading plan and adherence
This forms a trading cycle: observe → enter → record → review → plan → repeat. The cycle is continuous, as markets are dynamic, and growth comes from repeated application and review.
| استراتژی | STRATEGY | به مجموع قوانین و باید نباید هایی که در یک چهارچوب مشخص برای فعالیت در بازار از آن استفاده میکنید استراتژی گفته میشود |
| قیمت | PRICE | قیمت قابل معامله یک نماد معاملاتی که معمولا در سمت راست نمودار بصورت عمودی نمایش داده میشود |
| نمودار | CHART | کلیه تغییرات قیمت یک نماد را که در یک صفحه تسط کارگزاری یا صرافی برای ما نمایش داده میشود را نمودار میگوییم، که معمولا در قسمت پایین آن بصورت افقی بازه زمانی مشخص میشود و در سمت راست و بصورت عمودی قیمت |
| خریدار | BUYER | معامله گرانی که در جهت خرید و افزایش قیمت اقدام به معامله میکنند |
| فروشنده | SELLER | معامله گرانی که در جهت فروش و کاهش قیمت اقدام به معامله میکنند |
| بازار | MARKET | به جایی که در آن امکان انجام معاملات خرید و فروش وجود داشته باشد |
| رمز ارز | CRYPTOCURRENCY | ارزهایی که بواسطه تکنولوژی رمزنگاری امنیت مالکان و سرمایه گذاران در مقابل حمله هکرها حفظ میشود مانند بیت کوین |
| جفت ارز | CURRENCY PAIRS | نمادهای معاملاتی که شامل نرخ برابری دو ارز مختلف در مقابل هم میشود( مثال نرخ برابری یورو در مقابل پوند انگلستان میشود EUR/GBP) |
| سهام | STOCK | نمادهای معاملاتی که بیانگر ارزش سهام یک شرکت( مثال: اپل آمازون) می باشد |
| شاخص | INDEX | یک نماد معاملاتی که اعداد نمایش داده شده بیانگر ارزش مجموعه ای بخصوصی از نمادها می باشد که با فرمولی مشخص و از پیش تعیین شده نمایش داده میشود، که میتواند بیانگر ارزش سهام چندین شرکت و یا میزان ورود و خروج پول از بازاری مشخص باشد |
| بازار کالایی | COMMODITY MARKET | بازارهایی که در آن ارزش اقلام کالایی معامله میشود ( مثال: طلا، نفت، گندم، قهوه) |
| بازار آتی | FUTURES MARKET | نمادهایی که در آن ارزش آتی کالاها در لحظه مورد معامله قرار میگیرد (مثال طلا تحویل 6 ماه آینده) |
| کندل | CANDLE | ساده ترین شکل برای بیان تغییرات قیمت در بازه زمانی مشخص که در معنی بخاطر شکل ظاهری آن شمع گفته میشود و هر کندل بیانگر 4 عدد مهم میباشد عدد باز شدن، بالاترین عدد، کمترین عدد و عدد بسته شدن |
| بورس | STOCK EXCHANGE / EXCHANGE | بازاری که در آن نمادها ی مختلفی برای معامله وجود دارد از جمله سهام شرکتها ، کالایی و... |
| مالی رفتاری | BEHAVIORAL FINANCE | رویکردی است برای شناسایی رفتار حال حاضر معامله گرها که منجر به تشخیص نحوه گردش نقدینگی ها در بازارهای معاملاتی می شود |
| پذیره نویسی | SUBSCRIPTION | پذیرهنویسی فرایندی است که طی آن متعهد میشوید، قسمتی از سرمایه مورد نیاز شرکت را تامین کنید و در ازای آن صاحب درصدی از شرکت میشوید |
| مالی کلاسیک | CLASSIC FINANCE | یکی از روشهای تحلیلی در بازارها می باشد. در مالی کلاسیک تمرکز بر روی توجیه حرکات قیمت، بر اساس حرکاتی که در گذشته داشته است می¬باشد. |
| تکنیکال | TECHNICAL | یکی از روشهای معامله گری می باشد که تا حد زیادی وابسته به نتایج خروجی از ابزراهای کمکی مانند اندیکاتور و یا اسیلاتورها میباشد. |
| الگوهای هارمونیک | HARMONIC PATTERNS | در روش تکنیکال با استفاده از درصدهای مختلف تغییر قیمت اشکالی را بروی نمودار رسم میکنند با نام های مختلف مانند خفاش ،کوسه، پروانه و... انتظار دارند که قیمت به آن الگوها واکنش نشان دهد |
| الگوهای کلاسیک | CLASSIC PATTERNS | گاها بصورت تصادفی اشکالی توسط کندلها در بازارها شکل میگیرد مانند پرچم و یا سر شانه که تحلیل گران تکنیکالی به امید تکرار وقایع بعد از آن، سعی در ورود به معاملات با آنها دارند |
| الیوت | ELLIOTT | یک روش تحلیل می باشد که در آن حرکات بازار را به 5 موج اصلی و 3 موج اصلاحی تقسیم بندی میکنند و براساس درصدهای فیبوناچی انتظار واکنش قیمت در آن درصدها دارند |
| لو | LOW | پایینترین قیمت موجود را لو مینامیم حال ممکن است پایینترین قیمت در بازه زمانی یک کندل و یا پایینترین قیمت در یک سوئینگ باشد |
| های | HIGH | بالاترین قیمت موجود را های مینامیم حال ممکن است بالاترین قیمت در بازه زمانی یک کندل و یا بالاترین قیمت در یک سوئینگ باشد |
| اپن | OPEN | قیمت باز شدن و شروع یک کندل را اپن مینامیم |
| کلوز | CLOSE | قیمت بسته شدن و یا پایان یک کندل را کلوز مینامیم |
| اصلاح | CORRECTION | حرکت های کند، با قدرت و شیب کمتر در جهت خلاف حرکت اصلی |
| فاندامنتال | FUNDAMENTAL | علم تحلیل بر اساس اخبار و داده اقتصادی را فاندامنتل گفته میشود |
| گن | GANN | نام یک دانشمند که براساس تئوری آن در بازار یک سبک تحلیل وجود دارد |
| فیبوناچی | FIBONACCI | نام یک دانشمند که براساس تئوری آن در بازار یک سبک تحلیل وجود دارد |
| روند | TREND | حرکات منظم و پیوسته بازار که در یک جهت بخصوص شکل میگیرد |
| فوت پرینت | FOOTPRINT | یک روش معامله گری که براساس حجم سفارش های ارسال شده در بازار نقاط مهم را در بازار پیدا میکنند |
| تنش | TENSION | نقاطی که در آن بازار به هر شکل تغییر مسیر داده باشد حال یا اصلاحی یا برگشت کامل |
| تنش مثبت | POSITIVE TENSION | نقاطی که در آن بازار در جهت مثبت واکنش مهمی داشته باشد |
| تنش منفی | NEGATIVE TENSION | نقاطی که در آن بازار در جهت منفی واکنش مهمی داده باشد |
| سطوح تنش | TENSION LEVELS | با توجه به اینکه تنش ها معمولا در نقطهای خاص رخ نمیدهد برای رسم یک محدوده را بنوان سطح رسم میکنیم |
| بازار یک طرفه | ONE SIDED MARKET | بازار هایی که منافع معامله گران فقط در جهت رشد قیمت ها باشد |
| بازار دو طرفه | TWO SIDED MARKET | بازارهایی که در آن معامله گران میتوانند علاوه بر صعود در جهت ریزش ها نیز از بازار کسب سود کنند |
| لوریج | LEVERAGE | لوریج یا اهرم، ضریب اعمال شده از طرف کارگزاری و یا صرافی است که معاملهگر میتواند تا چند برابر موجودی خود معامله بگیرد |
| بازار آپشن | BINARY OPTION | معاملات آپشن یا معاملات اختیار معامله ابزاری است که به شما حق خرید یا فروش اوراق بهادار خاص را در یک تاریخ خاص و با قیمت مشخص میدهد |
| حراج | AUCTION | در معرض فروش قرار دان هر چیزی بعنوان مثال یک کالا و یا سهام |
| تئوری حراج | AUCTION THEORY | روند رشد قیمت یک کالا در حراجی بعنوان مثال زمانی که یک کالای بخصوص را در مکانی برای فروش قرار میدهند و تعداد زیادی خریدار برای بدست آوردن آن تلاش مکنند و در نهایت کالا به بالاترین قیمت داده میشود |
| هسته ی معاملات | CORE OF TRADES | مجموعه سرورهایی که تمامی دستورات معاملاتی به آن ارسال میشود |
| بانک | BANK | مکانی جهت حفظ،نگهداری و انتقال پول |
| اتاق پایاپای | CLEARING HOUSE | اتاق پایاپای نماینده تشکیلات اداری سازمان بورس کالا بهحساب میآید که مسئولیت اجرا و تسویه قراردادهای آتی معامله شده در بورس کالا بین اعضای این اتاق را بهصورت نقدی یا اعتباری به عهده دارد. |
| ریسک | RISK | میزان و یا احتمال شکست در یک معامله |
| نماد | SYMBOL | عنوان مشخص شده برای هر یک از آیتم های قابل معامله و یا قابل رصد در بازار بورس |
| مارکت دپس | MARKET DEPTH | میزان عمق معملات یعنی هر چه تعداد خریدار و فروشنده بیشتر باشد عمق آن بازار بیشتر است |
| لست بست پرایس | LAST BEST PRICE | آخرین و بهترین قیمت پیشنهاد شده در بازار و یا حراجی |
| صف انتظار | WAITING LIST | به تعداد خریدار و یا فروشنده که برای یک نماد مشخص منتظر انجام معاملات هستند |
| شادو | SHADOW | زمانی که قیمت در بازه زمانی یک کندل حرکتی را بعنوان مثال در جهت صعودانجام میدهد و به قیمت های بالاتر میرسد اما موفق به حفظ آن قیمت تا آخرین لحظه نمیشود، در زمان برگشت از اوج یک خط باریک بعنوان رد پای قیمت بجای میماند که نشان دهنده حداکثر قیمت در آن بازه زمانی می باشد |
| شادوی بالایی | HIGH SHADOW | سایه های که در قسمت بالای کندل شکل میگیرد |
| حرکت صعودی | UPWARD MOVEMENT / UPTREND | حرکت هایی که در جهت رشد قیمت اتفاق میافتد |
| عمق بازار | MARKET DEPTH | میزان عمق معملات یعنی هر چه تعداد خریدار و فروشنده بیشتر باشد عمق آن بازار بیشتر است |
| گپ قیمت | PRICE GAP | فاصله یا فضای پر نشده در نمودار که به دلیل حرکت سریع قیمت در هر یک از جهت ها رخ می دهد |
| دستور قیمت | PRICE ORDER | کلیه سفارشاتی که در جهت انجام یک معامله جدید و یا تغییرات ایجاد شده در یک معامله فعال به بازار ارسال میشود |
| پرش قیمت | PRICE JUMP (PUMP) | حرکت پر شتاب و سریع قیمت در جهت صعود |
| حرکت نزولی | DOWNWARD MOVEMENT / DOWNTREND | حرکت قیمت بدلیل کاهش قیمت |
| کندل استیک | CANDLESTICK | یک فرم قراردادی جهت نمایش تغییرات قیمت، نامگذاری بدلیل شباهت آن به شمع می باشد |
| بازار کارا | EFFICIENT MARKET | به بازاری گفته میشود که تعداد معاملهگران در آن بازار زیاد است و به قدری معاملات با حجم های بالا و به تعداد بالا در آن انجام می شود که تاثیرگذاری یک یا چند معامله گر خورد یا یک گروه محدود بر تغییرات قیمت را به حداقل ممکن می رساند |
| توالی تصادفی | RANDOM SEQUENCE | زمانی که یک اتفاق چندین بار بدون وجود دلیلی بخصوص رخ دهد |
| سوئینگ | SWING | چرخشهای قیمت در بازار |
| سوئینگ موثر | EFFECTIVE SWING | چرخشهای قیمت در بازار که منجر به تغییرات اساسی در قیمت میشود |
| تروکسلر | TROXLER | هنگامی که بیش از حد بخواهیم به موضوعی توجه کنیم و بیش از حد در مورد آن جست و جو کنیم، ذهن ما سرشار از اطلاعات شده و در نهایت آن موضوعی که باید را دیگر نمیبینیم |
| محدوده استاتیک | STATIC AREA | محدوده های چرخش قیمت که در یک امتداد افقی نسبت به هم و در یک راستا قرار دارند |
| محدوده داینامیک | DYNAMIC AREA | محدودهای چرخشی قیمت که بصورت مورب ولی در یک راستا قرار دارند |
| سطوح کلیدی | KEY LEVELS | سطوحی که از محل سوئینگ های موثر در گذشته بازار رسم میشود و تا به محدوده فعلی قیمت ادامه پیدا میکند. |
| حمایت | SUPPORT | نقاطی که در تحلیل تکنیکال انتظار میرود کاهش قیمت متوقف شود و یا قیمت رشد کند. |
| مقاومت | RESISTANCE | نقاطی که در تحلیل تکنیکال انتظار میرود افزایش قیمت متوقف شود و یا قیمت کاهش یابد. |
| خط روند | TREND LINE | خطی مورب که با استفاده از سقف ها یا کف های قیمت رسم میشود |
| کانال | CHANNEL | دو خط روند را که یکی بر روی سقف ها باشدو دیگری از زیر کف ها رسم شود. اگر در یک محدوده موازی باشد یک کانال تشکبل میشود |
| سطوح طلایی | GOLDEN LEVELS | سطحی که بدلیل وجود چرخش قیمت در گذشته بازار رسم شده اما این بار در صورت رسیدن قیت به آن واکنش معکوس ایجاد میکند |
| موومنت | MOVEMENT) | به مقدار حرکتی که قیمت پیشتر در لگ هم خانواده¬ی خود داشته است |
| شکست سطح | BREAKOUT | عبور قیمت از یک محدوده مهم استاتیک و یا داینامیک |
| پیپ | PIP | واحد اندازه گیری حرکت قیمت در بازار فارکس |
| پوینت | POINT | کوچکترین واحد اندازه گیری حرکت قیمت در بازا ر هر 10 پوینت برابر با یک پیپ |
| کارکشن | CORRECTION | حرکت اصلاحی در بازار که پس از یک حرکت اصلی اتفاق می افتد |
| دپس | DEPTH | عمق = میزان برگشت قیمت در حرکتها اصلاحی |
| هزینه | COST | مبلغ پرداخت شده جهت ورود به یک معامله که شامل دو بخش می باشد: 1- کمیسیون و مبالغ مربوط به بروکر یا صرافی جهت باز شدن و یا بسته شدن یک معامله 2- مبلغی که باید در صورت حرکت قیمت در خلاف جهت ما در بازار پرداخت شود |
| هارمونی | HARMONY | هم خوانی داشتن ، تناسب داشتن |
| شورت | SHORT | معاملات در جهت ریزش قیمت در بازارهای دوطرفه |
| لانگ | LONG | معاملات در جهت رشد قیمت ها |
| سل استاپ | SELL STOP | دستور ورود به معاملات فروش که در صورت ریزش قیمت فعال میشود |
| بای استاپ | BUY STOP | دستور ورود به معاملات خرید که در صورت رشد قیمت فعال میشود |
| سل لیمیت | SELL LIMIT | دستور ورود به معاملات فروش که در صورت رشد قیمت فعال میشود |
| بای لیمیت | BUY LIMIT | دستور ورود به معاملات خرید که در صورت ریزش قیمت فعال میشود |
| بیریش | BEARISH | بازار خرسی= بدلیل نوع حمله خرس در مبارزه به بازار های ریزشی خرسی یا بیریش گفته میشود |
| بولیش | BULLISH | بازار گاوی= بدلیل نوع حمله گاو در مبارزه به بازار های صعودی، گاوی یا بولیش گفته میشود |
| معاملات استقراضی | LONG/SHORT | نوعی از معاملات که در بازارهای دو طرفه انجام میشود |
| دستور معاملاتی | TRADING ORDER | هرگونه سفارشات ارسال شده به هسته بازار به منظور افتتاح یک معامله جدید یا ایجاد تغییرات در معاملات فعال |
| معاملات مشروط | CONDITIONAL TRADES | نوعی دستور معاملاتی که فعال شدن آن منوط به رخ دادن شرایطی می باشد که معامله گر از قبل تعیین کرده |
| معاملات پندینگ | PENDING TRADES | نوعی دستور معاملاتی که برای فعال شدن نیاز به محقق شدن شرایط از پیش تعیین شده معامله گر می باشد |
| اردر | ORDER | دستور ، سفارش |
| سل تو مارکت | SELL TO MARKET | فروش بصورت آنی و لحظه ای با قیمت جاری مارکت |
| کارگزار | BROKER/EXCHANGE | موسسه و یا نهادی که مسئول انتقال و همچنین صحت اجرای معاملات در بازار می باشد |
| بروکر | BROKER | شرکت ها و یا موسساتی که مسئول انتقال و همچنین صحت اجرای معاملات در بازار فارکس می باشد |
| پلتفرم | PLATFORM | نرم افزاری که از طریق آن میتوانید دستورات معاملاتی خود را به بازار ارسال کنید |
| متاتریدر | METATRADER | یکی از پلتفرم های معاملاتی که توسط بروکرها ارائه میشود |
| رزولوشن | RESOLUTION | وضوح دیداری |
| دیوایس | DEVICE | وسیله یا ابزاری که با آن کار میکنیم |
| متن بازار | MARKET CONTEXT | کندلهای موجود در بازار که با زوم استاندارد در یک صفحه نمایش میبینیم |
| لگ | LEG | حرکتهای قیمت که متشکل از چند کندل بصورت پیوسته در یک جهت بخصوص می باشد |
| سوئینگ لو | SWING LOW | چرخش های شکل گرفته در کف ها |
| سوئینگ های | SWING HIGH | چرخش های شکل گرفته در سقف ها |
| حرکت متلاطم و رنج | RANGE MOVEMENT | |
| رنج سایدوی | SIDEWAYS RANGE | زمانی رنج سایدوی ایجاد میشود که بازار در یک محدوده مشخص قیمتی حرکت کند. بنحوی که بتوانیم در آن محدوده وارد معامله بشویم و فرصت پیاده سازی مدیریت خروج نیز فراهم باشد |
| رنج چوپی | CHOPPY RANGE | زمانی رنج چوپی ایجاد میشود که قیمت در بصورت آشفته و نامنظم حرکت کند بنحوی که نتوان در آن معامله ای انجام داد |
| حرکت شارپ | SHARP MOVEMENT | حرکاتی که بصورت خیلی سریع و پر شتاب نسبت گذشته بازار اتفاق میافتد |
| جریان سفارشات | ORDER FLOW | میزان نقدینگی روانه شده و یا خارج شده به سمت یک نماد در جهت افزایش یا کاهش قیمت |
| اپن در کندل | OPEN IN CANDLE | عددی که قیمت بازگشایی بازه زمانی یک کندل است |
| کلوز در کندل | CLOSE IN CANDLE | عددی که قیمت پایانی و یا بسته شدن بازه زمانی یک کندل است |
| کندل صعودی | BULLISH CANDLE | زمانی که قیمت بسته شدن بالاتر از قیمت باز شدن باشد یک کندل صعودی تشکیل میشود |
| کندل نزولی | BEARISH CANDLE | زمانی که قیمت بسته شدن پایین تر از قیمت باز شدن باشد یک کندل نزولی تشکیل میشود |
| کارکشن استال | STALL | یکی از انواع اصلاح قیمتی می باشد که فرم آن بسیار فشرده میباشد و درصد برگشت قیمت در آن بسیار کم است حداکثر 15% |
| اسپایک | SPIKE | پر قدرت ترین پرتاب قیمت که فقط در ابتدای یک روند ایجاد میشود |
| کارکشن پولبک | PULLBACK | یکی از انواع اصلاح قیمتی می باشد که تا 30% میتواند برگشت ایجاد کند |
| کمپلکس پولبک | COMPLEX PULLBACK | یکی از انواع اصلاح قیمتی می باشد که ضعیف ترین حالت روند را نشان میدهد و معمولا یا بصورت فرسایشی پیش میرود ویا با دو لگ ایجاد میشود این نوع اصلاح تا 50% میتواند برگشت ایجاد کند |
| پولبک ریورسال | REVERSAL PULLBACK | یکی از انواع اصلاح می باشد که در سطوح تنش اتفاق میافتد و برای ورود به معاملات برگشتی کاربرد دارد |
| معاملات ادامه دهنده | CONTINUATION TRADES | هر نوع معامله ای که در جهت حرکت اصلی بازار و به هدف همراهی با روند باشد |
| پروجکشن | PROJECTION | حرکت های اصلی در یک روند که دارای قدرت، شتاب و پیوستگی بیشتری نسبت به حرکات اصلاحی میباشد . تکرار چند پروجکشن یک روند میسازد |
| ضریب سوددهی | PROFITABILITY RATIO | هرگاه در بازارهای معاملاتی، در یک جهت واحد مثلا روند صعودی عمق های اصلاح قیمتی کمتر شود و پروجکشن ها در حال زیاد شدن باشند و زاویه ها نیز در جهت صعود بیشتر شوند، معاملهگر درمییابد که این روند صعودی رو به افزایش است. به عبارتی ضریب چولگی در حال افزایش است. چرا که افزایش ضریب چولگی برابر با افزایش ورود نقدینگی است |
| ضریب چولگی | SKEWNESS | هرگاه در بازارهای معاملاتی، در یک جهت واحد مثلا روند صعودی عمق های اصلاح قیمتی کمتر شود و پروجکشن ها در حال زیاد شدن باشند و زاویه ها نیز در جهت صعود بیشتر شوند، معاملهگر درمییابد که این روند صعودی رو به افزایش است. به عبارتی ضریب چولگی در حال افزایش است. چرا که افزایش ضریب چولگی برابر با افزایش ورود نقدینگی است |
| اسلوپ | SLOPE | شیب حرکت قیمت در لگ های ایجاد شده |
| چرخه اسپایک | SPIKE CYCLE | یک بخش از مسیر تکامل یک حرکت کامل در بازار میباشد که از ویژگی اصلی آن : به نسبت سایر لگهاقدرت و شتاب بیشتری دارد و همچنین پرتاب قیمتی بیشتر ی را دارد و فقط در ابتدای یک روند ایجاد میشود |
| چرخه ترند | TREND CYCLE | یک بخش از مسیر تکامل یک حرکت کامل در بازار میباشد که معمولا در میانه روند می باشد و یژگی آن : دارای گام و اصلاح های منظم و پیوسته میباشد |
| چنگال اندروز | ANDREW’S PITCHFORK | یکی از ابزار های تحلیل تکنیکال و نام یک دانشمند |
| چرخه رنج | RANGE CYCLE | یک بخش از مسیر تکامل یک حرکت کامل در بازار میباشد که معمولا پس از روندها رخ میدهد ویژگی آن: در بازار حرکت پر قدرت و ادامهدار در هیچ جهتی رخ نمیدهد و معمولا لگهای ایجاد شده در هر دو جهت صعودی و نزولی باهم برابر هستند به نحوی که به سختی میتوان لگ اصلی و اصلاحی را تشخیص داد |
| نظریه شپارد | SHEPARD’S THEORY | این نظریه بیان میکند که هر آن چیزی را که ما مشاهده میکنیم، نمیتواند واقعا درست باشد. |
| لبه ورود | ENTRY EDGE | کندل تایید نهایی برای ورود به فرصت های معاملاتی |
| ستاپ معاملاتی | TRADING SETUP | هرگاه در بازار تغییرات ایجاد شده بنحوی باشد که برای ما یک فرصت ورود به معامله را فراهم کند میگوییم ستاپ معاملاتی تشکیل شده |
| اسپرد | SPREAD | اختلاف عدد بین قیمت اصلی و زنده یک نماد و قیمتی که کارگزار و یا صرافی معامله را باز میکند. در واقع اسپرد هزینه ای است که کارگزاری از معامله گر در جهت افتتاح یک معامله جدید دریافت میکند. |
| خواب سرمایه | SHORTEST WAITING TIME FOR PROFIT | زمان سپری شده تا لحظه به سود رسیدن یک معامله |
| حد ضرر | STOP LOSS | عددی که برای یک موقعیت معاملاتی مشخص میکنیم تا در صورت حرکت قیمت در خلاف جهت ما بروکر بصورت خودکار معامله را متوقف کند. بعبارتی حداکثر ضرر قابل پذیرش از طرف معامله گر که به بروکر اعلام میکند |
| ریسک به ریوارد | RISK TO REWARD | نسبت ضرر به سود یک معامله |
| سیستم تهاجمی تشویقی | INVASIVE INCENTIVE SYSTEM | یکی از روشهای مدیریت مالی می باشد که با اعمال ضریب بخصوصی در جهت رشد حساب برنامه ریزی میکند |
| اثر مرکب | COMPOUND EFFECT | اثر مرکب، اصل بدست آوردن پاداش های بزرگ از طریق مجموعه ای از تغییرات مثبت، کوچک و هوشمندانه است که بصورت پیوسته تکرار میشود. |
| استراتژی خروج | EXIT STRATEGY | روشی که برای خروج از معاملات انتخاب میکنیم که میتواند برای هر شخص متفاوت باشد |
| تی پی | TP/TAKE PROFIT | عددی که بمنظور کسب سود و خارج شدن تمام و یا بخشی از یک موقعیت معاملاتی به بروکر یا صرافی اعلام میکنیم |
| ژورنال | JOURNAL | مجموعه ای ثبت شده از رفتارها جهت ارزیابی مجدد و پیدا کردن نقاط ضعف و قوت |
| پرتاب قیمت | PROJECTION | حرکت های اصلی در یک روند که دارای قدرت، شتاب و پیوستگی بیشتری نسبت به حرکات اصلاحی میباشد . تکرار چند پرتاب قیمت یک روند میسازد |
| عمق | DEPTH | میزان برگشت قیمت در حرکتهای اصلاحی |
| شیب | SLOPE | زاویهی ایجاد شده توسط قیمت در لگ ها |


